工具系列:TimeGPT_(2)使用外生变量时间序列预测
发布时间:2023年12月26日
TimeGPT使用外生变量时间序列预测
外生变量在时间序列预测中非常重要,因为它们提供了可能影响预测的额外信息。这些变量可以包括假日标记、营销支出、天气数据或与你正在预测的时间序列数据相关的任何其他外部数据。
例如,如果你正在预测冰淇淋销售额,温度数据可以作为一个有用的外生变量。在炎热的天气里,冰淇淋销售额可能会增加。
要在TimeGPT中加入外生变量,你需要将时间序列数据中的每个点与相应的外部数据配对。
导入相关工具包
# Importing the colab_badge module from the nixtlats.utils package
from nixtlats.utils import colab_badge
# 导入load_dotenv函数,用于加载.env文件中的环境变量
from dotenv import load_dotenv
# 导入load_dotenv函数,用于加载环境变量
load_dotenv()
True
import pandas as pd
from nixtlats import TimeGPT
/home/ubuntu/miniconda/envs/nixtlats/lib/python3.11/site-packages/statsforecast/core.py:25: TqdmWarning: IProgress not found. Please update jupyter and ipywidgets. See https://ipywidgets.readthedocs.io/en/stable/user_install.html
  from tqdm.autonotebook import tqdm
# 定义TimeGPT对象,并传入一个参数token,用于身份验证
# 如果没有提供token参数,则默认使用os.environ.get("TIMEGPT_TOKEN")获取token
timegpt = TimeGPT(
    token = 'my_token_provided_by_nixtla'
)
# 导入TimeGPT模型

timegpt = TimeGPT()  # 创建TimeGPT对象的实例
预测欧美国家次日电力价格案例
让我们看一个关于预测次日电力价格的例子。以下数据集包含了欧洲和美国五个市场的每小时电力价格(y列),这些市场由unique_id列进行标识。从Exogenous1到day_6的列是TimeGPT用来预测价格的外生变量。
# 从指定的URL读取csv文件,并将其存储在DataFrame对象df中
df = pd.read_csv('https://raw.githubusercontent.com/Nixtla/transfer-learning-time-series/main/datasets/electricity-short-with-ex-vars.csv')

# 显示DataFrame对象df的前几行数据
df.head()
| unique_id | ds | y | Exogenous1 | Exogenous2 | day_0 | day_1 | day_2 | day_3 | day_4 | day_5 | day_6 | |
|---|---|---|---|---|---|---|---|---|---|---|---|---|
| 0 | BE | 2016-12-01 00:00:00 | 72.00 | 61507.0 | 71066.0 | 0.0 | 0.0 | 0.0 | 1.0 | 0.0 | 0.0 | 0.0 |
| 1 | BE | 2016-12-01 01:00:00 | 65.80 | 59528.0 | 67311.0 | 0.0 | 0.0 | 0.0 | 1.0 | 0.0 | 0.0 | 0.0 |
| 2 | BE | 2016-12-01 02:00:00 | 59.99 | 58812.0 | 67470.0 | 0.0 | 0.0 | 0.0 | 1.0 | 0.0 | 0.0 | 0.0 |
| 3 | BE | 2016-12-01 03:00:00 | 50.69 | 57676.0 | 64529.0 | 0.0 | 0.0 | 0.0 | 1.0 | 0.0 | 0.0 | 0.0 |
| 4 | BE | 2016-12-01 04:00:00 | 52.58 | 56804.0 | 62773.0 | 0.0 | 0.0 | 0.0 | 1.0 | 0.0 | 0.0 | 0.0 |
为了生成预测,我们还需要添加外生变量的未来值。让我们读取这个数据集。在这种情况下,我们希望预测未来24个步骤,因此每个“unique_id”将有24个观察值。
# 从GitHub上读取电力短期未来外部变量数据集
future_ex_vars_df = pd.read_csv('https://raw.githubusercontent.com/Nixtla/transfer-learning-time-series/main/datasets/electricity-short-future-ex-vars.csv')

# 打印数据集的前五行
future_ex_vars_df.head()
| unique_id | ds | Exogenous1 | Exogenous2 | day_0 | day_1 | day_2 | day_3 | day_4 | day_5 | day_6 | |
|---|---|---|---|---|---|---|---|---|---|---|---|
| 0 | BE | 2016-12-31 00:00:00 | 64108.0 | 70318.0 | 0.0 | 0.0 | 0.0 | 0.0 | 0.0 | 1.0 | 0.0 |
| 1 | BE | 2016-12-31 01:00:00 | 62492.0 | 67898.0 | 0.0 | 0.0 | 0.0 | 0.0 | 0.0 | 1.0 | 0.0 |
| 2 | BE | 2016-12-31 02:00:00 | 61571.0 | 68379.0 | 0.0 | 0.0 | 0.0 | 0.0 | 0.0 | 1.0 | 0.0 |
| 3 | BE | 2016-12-31 03:00:00 | 60381.0 | 64972.0 | 0.0 | 0.0 | 0.0 | 0.0 | 0.0 | 1.0 | 0.0 |
| 4 | BE | 2016-12-31 04:00:00 | 60298.0 | 62900.0 | 0.0 | 0.0 | 0.0 | 0.0 | 0.0 | 1.0 | 0.0 |
让我们调用forecast方法,添加这些信息:
# 使用timegpt模型对数据进行预测
# 参数说明:
# - df: 历史数据的DataFrame
# - X_df: 未来外部变量的DataFrame
# - h: 预测的时间步长
# - level: 置信水平
timegpt_fcst_ex_vars_df = timegpt.forecast(df=df, X_df=future_ex_vars_df, h=24, level=[80, 90])

# 打印预测结果的前几行
timegpt_fcst_ex_vars_df.head()
INFO:nixtlats.timegpt:Validating inputs...
INFO:nixtlats.timegpt:Preprocessing dataframes...
INFO:nixtlats.timegpt:Inferred freq: H
INFO:nixtlats.timegpt:Calling Forecast Endpoint...
| unique_id | ds | TimeGPT | TimeGPT-lo-90 | TimeGPT-lo-80 | TimeGPT-hi-80 | TimeGPT-hi-90 | |
|---|---|---|---|---|---|---|---|
| 0 | BE | 2016-12-31 00:00:00 | 38.861762 | 33.821073 | 34.368669 | 43.354854 | 43.902450 |
| 1 | BE | 2016-12-31 01:00:00 | 35.382102 | 30.014594 | 31.493322 | 39.270882 | 40.749610 |
| 2 | BE | 2016-12-31 02:00:00 | 33.811425 | 26.658821 | 28.543087 | 39.079764 | 40.964029 |
| 3 | BE | 2016-12-31 03:00:00 | 31.707475 | 24.896205 | 26.818795 | 36.596155 | 38.518745 |
| 4 | BE | 2016-12-31 04:00:00 | 30.316475 | 21.125143 | 24.432148 | 36.200801 | 39.507807 |
# 导入必要的模块和函数

# 使用timegpt.plot函数绘制时间序列预测结果的图表
# 参数1:df[['unique_id', 'ds', 'y']],表示要绘制的时间序列数据,包括唯一标识符、时间戳和目标变量
# 参数2:timegpt_fcst_ex_vars_df,表示时间序列预测的额外变量数据
# 参数3:max_insample_length=365,表示用于训练模型的最大历史数据长度为365天
# 参数4:level=[80, 90],表示绘制置信区间的水平,这里设置为80%和90%
# 返回:绘制好的时间序列预测结果图表
timegpt.plot(
    df[['unique_id', 'ds', 'y']],
    timegpt_fcst_ex_vars_df,
    max_insample_length=365,
    level=[80, 90],
)

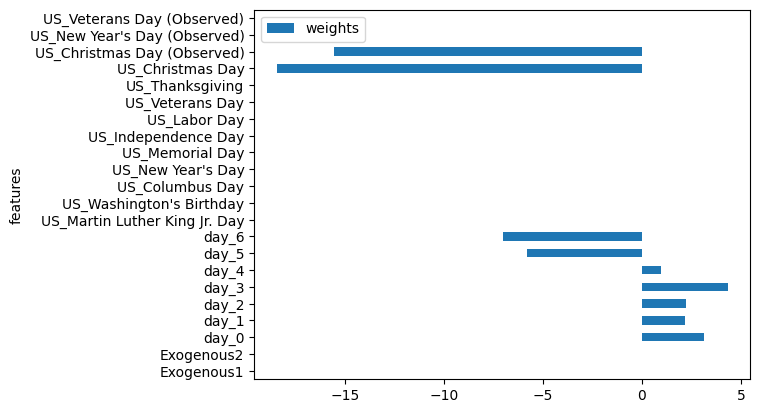
我们还可以获得特征的重要性。
# 绘制水平条形图
timegpt.weights_x.plot.barh(x='features', y='weights')
<Axes: ylabel='features'>

您还可以使用CountryHolidays类添加国家假期。
# 导入nixtlats.date_features模块中的CountryHolidays类

from nixtlats.date_features import CountryHolidays
# 导入所需的模块和函数

# 使用timegpt模型对给定的数据进行预测
# 参数:
# - df: 历史数据的DataFrame,包含时间序列数据
# - X_df: 未来外部变量的DataFrame,包含与时间序列相关的外部变量
# - h: 预测的时间步长,即预测未来多少个时间点的值
# - level: 置信水平的列表,用于计算置信区间
# - date_features: 日期特征的列表,用于考虑特殊的日期效应,如假期等
# 返回值:
# - timegpt_fcst_ex_vars_df: 预测结果的DataFrame,包含预测值和置信区间
timegpt_fcst_ex_vars_df = timegpt.forecast(
    df=df, X_df=future_ex_vars_df, h=24, level=[80, 90],
    date_features=[CountryHolidays(['US'])]
)
# 使用timegpt模型的weights_x属性绘制水平条形图
# 参数:
# - x: 水平条形图的x轴数据,即特征名称
# - y: 水平条形图的y轴数据,即特征权重值
timegpt.weights_x.plot.barh(x='features', y='weights')
INFO:nixtlats.timegpt:Validating inputs...
INFO:nixtlats.timegpt:Preprocessing dataframes...
INFO:nixtlats.timegpt:Inferred freq: H
INFO:nixtlats.timegpt:Calling Forecast Endpoint...


<Axes: ylabel='features'>
文章来源:https://blog.csdn.net/wjjc1017/article/details/135233108
本文来自互联网用户投稿,该文观点仅代表作者本人,不代表本站立场。本站仅提供信息存储空间服务,不拥有所有权,不承担相关法律责任。 如若内容造成侵权/违法违规/事实不符,请联系我的编程经验分享网邮箱:chenni525@qq.com进行投诉反馈,一经查实,立即删除!
本文来自互联网用户投稿,该文观点仅代表作者本人,不代表本站立场。本站仅提供信息存储空间服务,不拥有所有权,不承担相关法律责任。 如若内容造成侵权/违法违规/事实不符,请联系我的编程经验分享网邮箱:chenni525@qq.com进行投诉反馈,一经查实,立即删除!
最新文章
- Python教程
- 深入理解 MySQL 中的 HAVING 关键字和聚合函数
- Qt之QChar编码(1)
- MyBatis入门基础篇
- 用Python脚本实现FFmpeg批量转换
- EXCEL VBA网抓技巧-复制网页表格,不用遍历单元格
- 主流大语言模型从预训练到微调的技术原理
- 2024美赛全方位备赛教学/翻译/写作模版/翻译/软件/资料
- 【卡梅德生物】抗体发现服务
- 数据结构OJ实验14-哈希查找
- ITECH 艾德克斯 IT6722A 可编程电源
- 大型企业SD-WAN异地组网实例分析
- 动手学深度学习4 线性代数
- 专科毕业,应届生零基础如何七天搞定自动化测试?
- 12V 全桥驱动芯片GC9008——可替代TMI8118,应用于摄像机、消费类产品上