机器学习之matplotlib学习
发布时间:2024年01月23日
matplotlib库学习
matplotlib库的介绍
折线图的绘制
绘制折线图使用plot函数进行绘制
第一个参数为x 横坐标,第二个参数为y纵坐标,第三个参数为线的颜色和类型,第四个参数是线的标签
绘制完成之后使用show函数,将图形展示出来
简单的折线图演示
#绘制折线图
x = [1, 2, 3, 4, 5]
y = [10, 23, 90, 12, 89]

plt.plot(x, y)
plt.show()
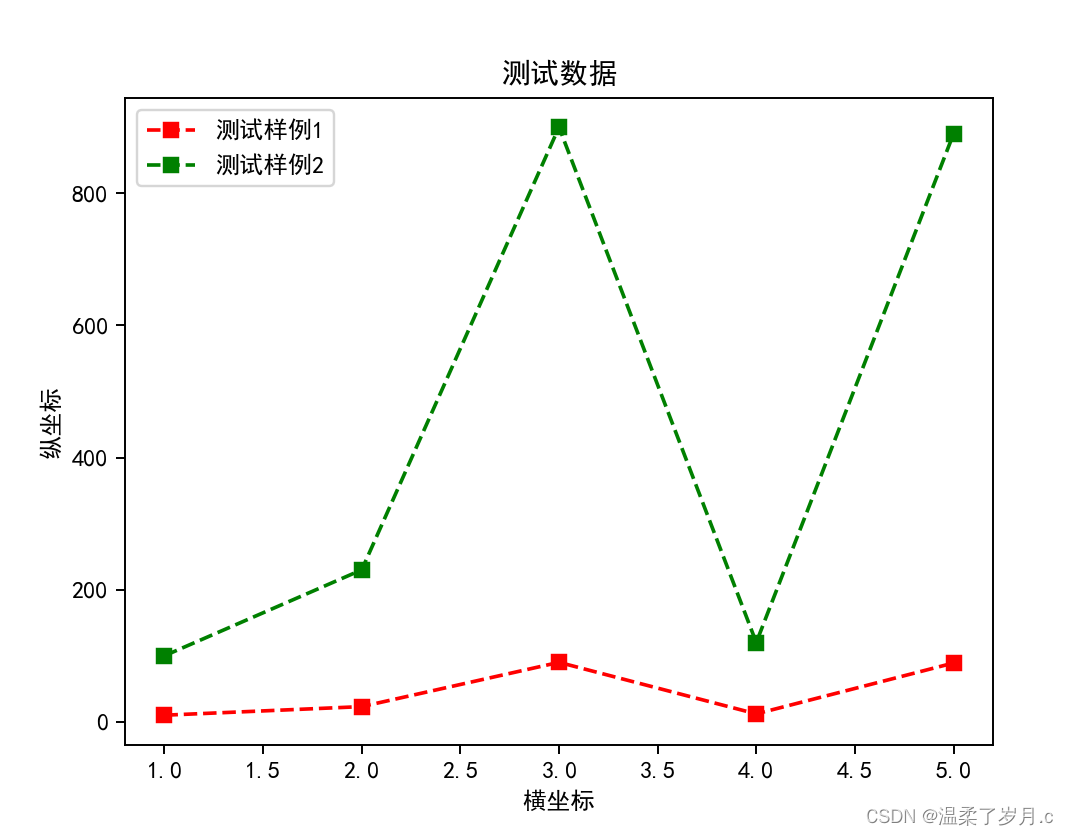
较为全面的折线图演示
import matplotlib.pyplot as plt  #导入库

#绘制折线图
x = [1, 2, 3, 4, 5]
y = [10, 23, 90, 12, 89]


plt.plot(x, y, "rs--", label="测试样例1")

x1 = [1, 2, 3, 4, 5]
y2 = [100, 230, 900, 120, 890]

#字体的设置
#可选粗细有 ['light','normal','medium','semibold','bold','heavy','black']
#可选样式 ['normal','italic','oblique']

#此处为全局设置字体
# 汉字字体,优先使用楷体,找不到则使用黑体
plt.rcParams['font.sans-serif'] = ['Kaitt', 'SimHei']
# 正常显示负号
plt.rcParams['axes.unicode_minus'] = False

font1 = {'family': 'SimSun', 'weight': 'normal', 'size': 10}

#标签的设置,第三个参数可设置字体,这里采用字体全局设置了,所以不需要
plt.title("测试数据")
plt.xlabel("横坐标")
plt.ylabel("纵坐标")

#g-代表绿色,r代表红色,--代表线段
# s , d 代表形状,这里用的s

plt.plot(x1, y2, "gs--", label="测试样例2")

plt.legend()  #显示图例、

plt.show()
导入excel表数据绘制折线图
import matplotlib.pyplot as plt
import pandas as pd

fm = pd.read_excel(r"C:\Users\惊艳了时光\Desktop\销售额表.xlsx")

#字体格式的设置
plt.rcParams['font.sans-serif'] = ['Kaitt', 'SimHei']
plt.rcParams['axes.unicode_minus'] = False

x = fm["月份"]
y = fm["销售额"]

# 绘制折线图
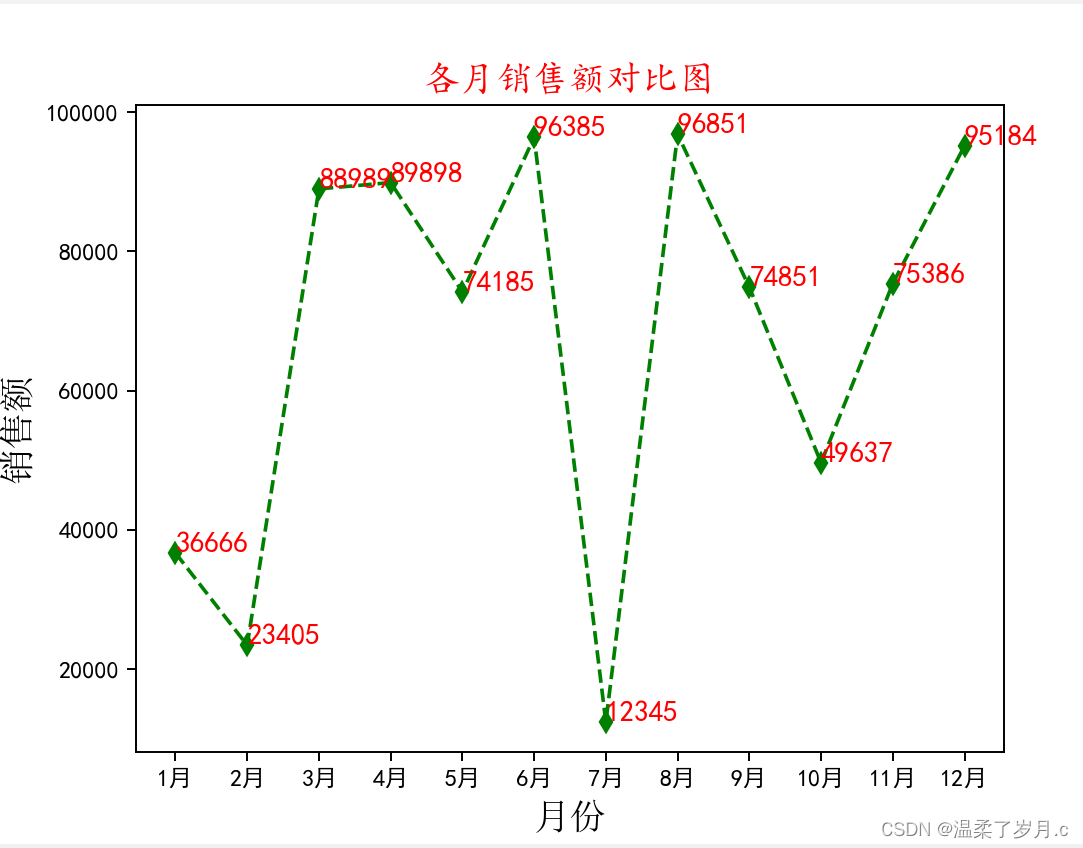
plt.plot(x, y,"gd--")

# 添加并设置图表标题、X轴标题、Y轴标题
plt.title(label = '各月销售额对比图', fontdict = {'family' : 'KaiTi', 'color' : 'red', 'size' : 15}, loc = 'center')
plt.xlabel('月份', fontdict = {'family' : 'SimSun', 'color' : 'black', 'size' : 15}, labelpad = 5)
plt.ylabel('销售额', fontdict = {'family' : 'SimSun', 'color' : 'black', 'size' : 15}, labelpad = 5)

# 添加并设置数据标签
for a, b in zip(x, y):
    plt.text(a, b, b, fontdict={'family': 'KaiTi', 'color': 'red', 'size': 12})
plt.show()  # 显示绘制的图表
柱状图的绘制
import matplotlib.pyplot as plt
import pandas as pd

fm = pd.read_excel(r"C:\Users\惊艳了时光\Desktop\销售额表.xlsx")

#字体格式的设置
plt.rcParams['font.sans-serif'] = ['Kaitt', 'SimHei']
plt.rcParams['axes.unicode_minus'] = False

x = fm["月份"]
y = fm["销售额"]

# 绘制柱形图
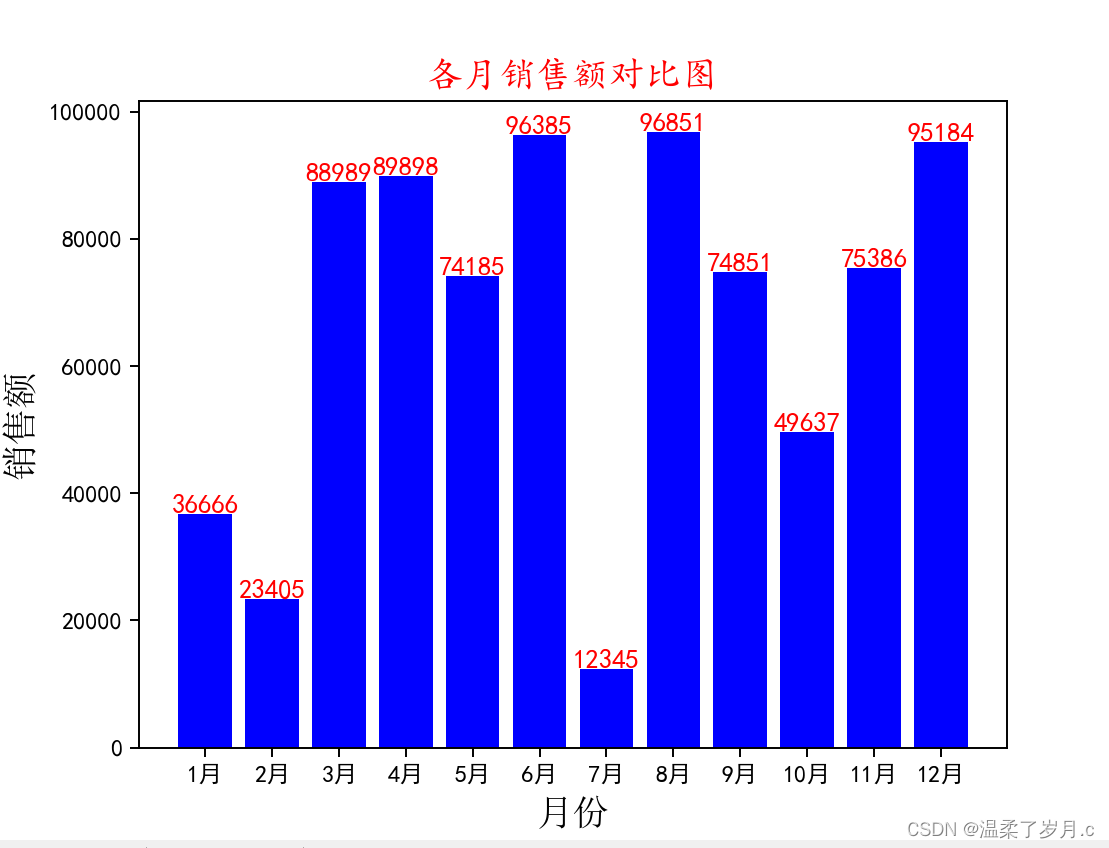
plt.bar(x, y, color='blue', label = '销售额')

# 添加并设置图表标题、X轴标题、Y轴标题
plt.title(label = '各月销售额对比图', fontdict = {'family' : 'KaiTi', 'color' : 'red', 'size' : 15}, loc = 'center')
plt.xlabel('月份', fontdict = {'family' : 'SimSun', 'color' : 'black', 'size' : 15}, labelpad = 5)
plt.ylabel('销售额', fontdict = {'family' : 'SimSun', 'color' : 'black', 'size' : 15}, labelpad = 5)

# 添加并设置数据标签
for a, b in zip(x, y):
    plt.text(a, b, b, fontdict={'family': 'KaiTi', 'color': 'red', 'size': 11}, horizontalalignment = "center")
plt.show()  # 显示绘制的图表
散点图的绘制
import matplotlib.pyplot as plt
import pandas as pd

fm = pd.read_excel(r"C:\Users\惊艳了时光\Desktop\销售额表.xlsx")

#字体格式的设置
plt.rcParams['font.sans-serif'] = ['Kaitt', 'SimHei']
plt.rcParams['axes.unicode_minus'] = False

x = fm["月份"]
y = fm["销售额"]

# 绘制散点图
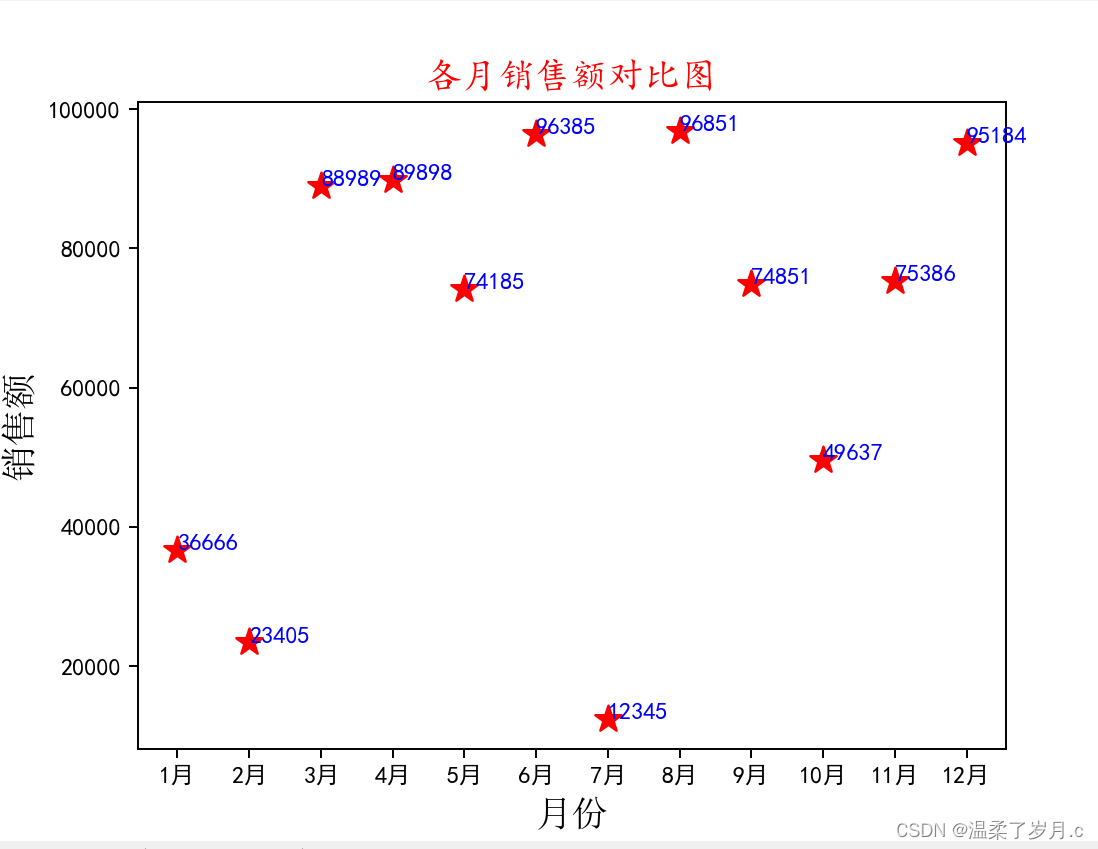
plt.scatter(x, y, s=130, color='red', marker='*', label = '销售额')    # 制作散点图

# 添加并设置图表标题、X轴标题、Y轴标题
plt.title(label = '各月销售额对比图', fontdict = {'family' : 'KaiTi', 'color' : 'red', 'size' : 15}, loc = 'center')
plt.xlabel('月份', fontdict = {'family' : 'SimSun', 'color' : 'black', 'size' : 15}, labelpad = 5)
plt.ylabel('销售额', fontdict = {'family' : 'SimSun', 'color' : 'black', 'size' : 15}, labelpad = 5)

# 添加并设置数据标签
for a, b in zip(x, y):
    plt.text(a, b, b, fontdict={'family': 'KaiTi', 'color': 'blue', 'size': 10}, horizontalalignment = "left")
plt.show()  # 显示绘制的图表
扇形图的绘制
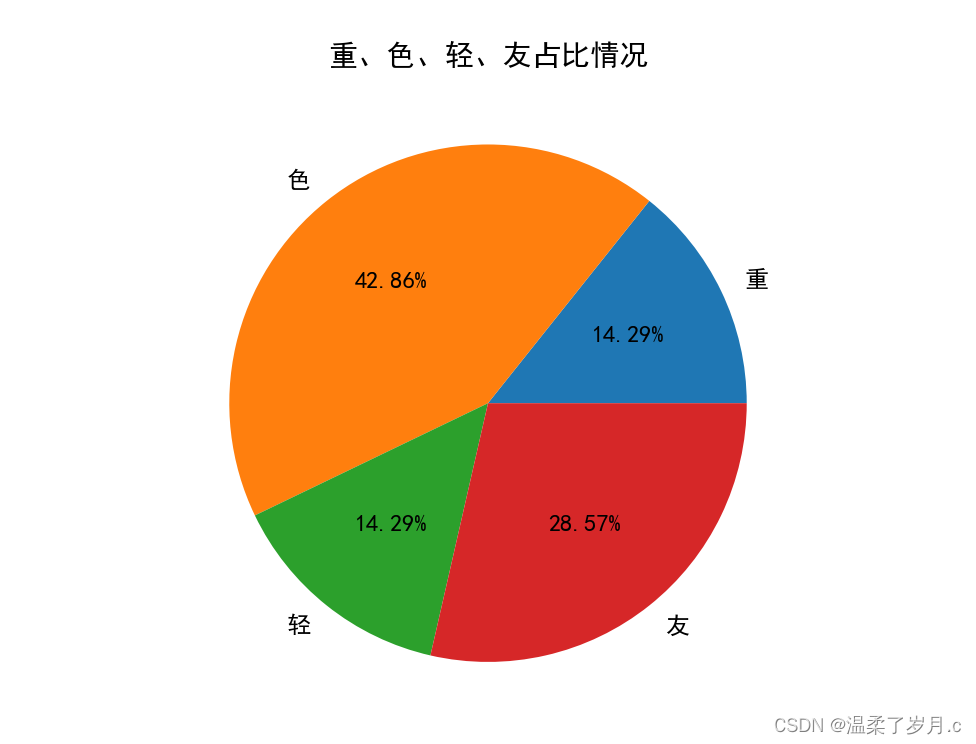
import matplotlib.pyplot as plt
plt.rcParams['font.sans-serif'] = 'simhei'
data = [100, 300, 100, 200]
label = ['重', '色', '轻', '友']
plt.pie(data, labels = label, autopct='%.2f%%')
plt.title('重、色、轻、友占比情况')
plt.show()
总结
从代码上看,散点图,柱形图以及折线图的代码基本一样,就各个画的图形那段代码不一样
散点图:plt.scatter()
折线图:plt.plot()
柱形图:plt.bar()
至于其他装饰的函数的细节部分,不清楚的,可详细查查该函数的用法和参数,因为函数以及函数的参数太多,我这就没一一列举
至于扇形图的话:plt.pie()
区别于前三种,前三种需要x,y,扇形图就需要数据就行了
文章来源:https://blog.csdn.net/m0_74228185/article/details/135585248
本文来自互联网用户投稿,该文观点仅代表作者本人,不代表本站立场。本站仅提供信息存储空间服务,不拥有所有权,不承担相关法律责任。 如若内容造成侵权/违法违规/事实不符,请联系我的编程经验分享网邮箱:chenni525@qq.com进行投诉反馈,一经查实,立即删除!
本文来自互联网用户投稿,该文观点仅代表作者本人,不代表本站立场。本站仅提供信息存储空间服务,不拥有所有权,不承担相关法律责任。 如若内容造成侵权/违法违规/事实不符,请联系我的编程经验分享网邮箱:chenni525@qq.com进行投诉反馈,一经查实,立即删除!
最新文章
- Python教程
- 深入理解 MySQL 中的 HAVING 关键字和聚合函数
- Qt之QChar编码(1)
- MyBatis入门基础篇
- 用Python脚本实现FFmpeg批量转换
- sql注入中的异或注入--sql注入加强版(盲注)[极客大挑战 2019]FinalSQL
- 寄大件是发物流还是寄快递?有什么优惠渠道?
- 个人微信全面养号、防封、加人机制
- 设计模式——单例模式
- 尚硅谷——第六章、面向对象(下)
- 无限debugger通杀方案——定制chromium
- ssm基于BS架构的法律咨询系统的分析与设计论文
- 知虾shopee数据:为卖家提供了丰富的数据分析工具
- Python+Django+Mysql+SimpleUI搭建后端用户管理系统(非常详细,每一步都清晰,列举了里面所有使用的方法属性)
- 每日一题——1295.统计位数为偶数的数字