R语言(12):绘图
发布时间:2024年01月08日
12.1 创建图形
12.1.1 plot函数
plot(c(1,2,3),c(1,2,4))
plot(c(1,2,3),c(1,2,4),"b")
plot(c(-3,3),c(-1,5),"n",xlab = "x",ylab = "y")


12.1.2 添加线条:abline()函数
x <- c(1,2,3)
y <- c(1,3,8)
plot(x,y)
lmout <- lm(y~x)
abline(lmout) #添加一条直线
abline(lmout$coefficients)
abline(2,1)
lines(c(1.5,2.5),c(3,3)) #添加一条线段,端点为(1.5,3),(2.5,3)
lines(c(1.5,2.5),c(3,4),"l",lty = "dotted")#设定线条的类型
?par
12.1.3 设备窗口(掌握)
新建窗口和新建图形不是一个东西,新建的窗口只有一个
主要的步骤(1)新建设备窗口(2)切换设备窗口
windows() #在保持原有图形的基础上新建图形窗口
X11()
dev.new()
plot(x,y,"n")
lines(c(1.5,2.5),c(3,3),"l",lty = "dotted")
lines(c(1.5,2.5),c(3,4),"l",lty = "dashed")
dev.set(3) #切换图形窗口
12.1.4 在一张图中绘制两条密度曲线
一定要先新建再添加
e1 <- rbinom(100,120,0.55)
d1 <- density(e1,from= 0,to =100)
plot(d1,main= "",xlab = "")
e2 <- rnorm(100,60,10)
d2 <- density(e2,from= 0,to =100)
lines(d2,lty = "dashed")

坐标轴的范围是根据第一个来画的
12.1.6 添加点
e1 <- rbinom(100,120,0.55)
d1 <- density(e1,from= 0,to =100)
plot(d1,main= "",xlab = "")
e2 <- rnorm(100,60,10)
d2 <- density(e2,from= 0,to =100)
lines(d2,lty = "dashed")
12.1.8 添加文字:text()函数
text(2.5,4,"abc") #字符中心位于输入的坐标参数上
text(40,.02,"Exam1")
text(56,.05,"Exam2")

12.1.9 精确定位:locator()函数
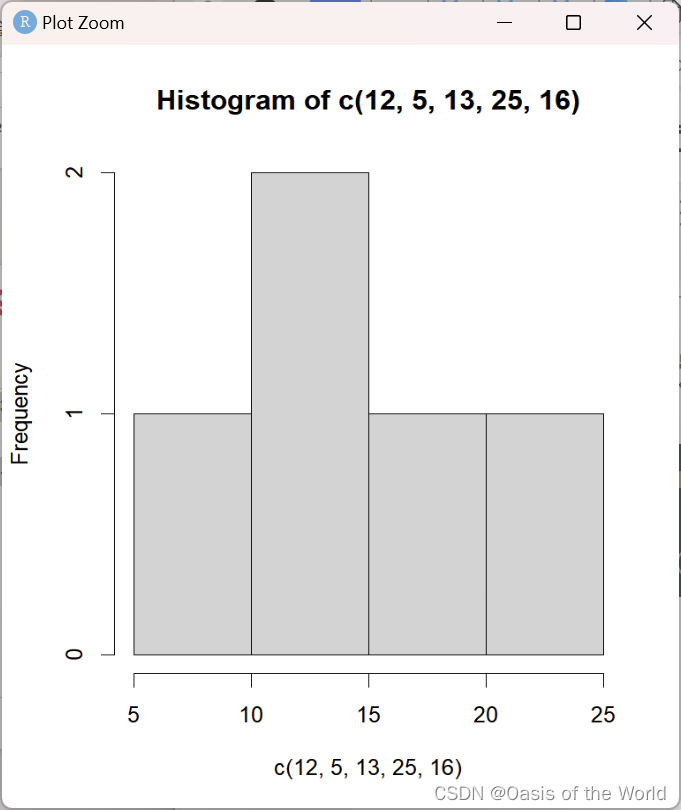
hist(c(12,5,13,25,16))
locator(1)
text(locator(1),"nv= 75")

12.1.10 保存图形
#R语言中没有“撤销命令”!只能通过先保存再读取的方式恢复图形。

img1 <- recordPlot()
text(locator(1),"nv= 74")
replayPlot(img1)
12.2 定制图形
12.2.3 添加多边形:polygon()
f <- function(x) return(1-exp(-x))
curve(f,0,2)
polygon(c(1.2,1.4,1.4,1.2),c(0,0,f(1.3),f(1.3)),col = "gray")
polygon(c(1,1.2,1.2,1),c(0,0,f(1.3),f(1.3)),density= 10)
12.2.5 绘制具有显示表达式的函数
g <- function(t){return((t^2 + 1)^0.5)}
x <- seq(0,5,length=5000)
y <- g(x)
plot(x,y,type= "l")
或
curve( (x^2 +1)^0.5+.5, 0, 5 , add=T) #如果add为真,则将曲线添加到当前工作图形设备中,若为假则新建一个图形设备
或
plot(g,0,5)
12.2.6 放大曲线的一部分
将曲线的一部分截取后进行放大绘制,并将其放在与原曲线的同一个图形中。

#savexy : 包含了由crv()函数返回的x和y向量的列表
#x1, y1, x2, y2: 要放大的曲线的区域
#x3, y3, x4, y4: 要添加的矩形的坐标
inset <- function(savexy, x1,y1,x2,y2,x3,y3,x4,y4){
rect(x1,y1,x2,y2) #画矩形
rect(x3,y3,x4,y4) #画矩形
savex <- savexy$x; savey <- savexy$y
n <- length(savex)
xvalsinrange <- which(savex >= x1 & savex <= x2)
yvalsforthosex <- savey[xvalsinrange]
if (any(yvalsforthosex < y1|yvalsforthosex >y2)){
print("Y value outside first box"); return()}
x2mnx1 <- x2- x1; x4mnx3 <- x4- x3; y2mny1 <- y2- y1; y4mny3 <- y4- y3
plotpt <- function(i){ #进行坐标转换
newx <- x3 + ((savex[i]-x1)/x2mnx1)*x4mnx3; newy <- y3 + ((savey[i]-y1)/y2mny1)*y4mny3
return(c(newx,newy))}
newxy <- sapply(xvalsinrange,plotpt)
lines(newxy[1,],newxy[2,])}


xyout <- crv(exp(-x)*sin(1/(x-1.5)),0.1,4,n=5001)
inset(xyout,1.3,-0.3,1.47,0.3,   2.5,-0.3,4,-0.1)
12.3 将图形保存到文件
dev.new()
pdf("d12.pdf") #创建并打开一个pdf文件
dev.list() #查询图形设备列表
dev.cur() #查询当前工作图形设备的编号
12.3.2 保存已显示的图形
dev.set(2)
xyout <- crv(exp(-x)*sin(1/(x-1.5)),0.1,4,n=5001)
inset(xyout,1.3,-0.3,1.47,0.3,   2.5,-0.3,4,-0.1)
dev.copy(which=3)#将当前设备中的图形复制到3号设备中
dev.set(3)
dev.off()#关闭图形设备以便查看
文章来源:https://blog.csdn.net/qq_64279967/article/details/134963894
本文来自互联网用户投稿,该文观点仅代表作者本人,不代表本站立场。本站仅提供信息存储空间服务,不拥有所有权,不承担相关法律责任。 如若内容造成侵权/违法违规/事实不符,请联系我的编程经验分享网邮箱:chenni525@qq.com进行投诉反馈,一经查实,立即删除!
本文来自互联网用户投稿,该文观点仅代表作者本人,不代表本站立场。本站仅提供信息存储空间服务,不拥有所有权,不承担相关法律责任。 如若内容造成侵权/违法违规/事实不符,请联系我的编程经验分享网邮箱:chenni525@qq.com进行投诉反馈,一经查实,立即删除!
最新文章
- Python教程
- 深入理解 MySQL 中的 HAVING 关键字和聚合函数
- Qt之QChar编码(1)
- MyBatis入门基础篇
- 用Python脚本实现FFmpeg批量转换
- 位移贴图、凹凸贴图和法线贴图之间的差异
- python-分享篇-draw heart
- 浪潮信息:打造IT领域首个数字样机应用,荣膺鼎革奖
- MATLAB求解微积分(代码+详细解读)
- 函数——自制函数(c++)
- 如何编写kubernetes中使用的yaml文件?(基础概括版)
- 接口测试用例设计
- 丰田金融服务公司被勒索800万美元
- 电商平台自动化:通途ERP2.0无代码开发连接与集成API
- 简述Linux下fork与vfork的使用与区别