【数学建模美赛M奖速成系列】Matplotlib绘图技巧(三)
发布时间:2023年12月30日
Matplotlib绘图技巧(三)
写在前面
终于更新完Matplotlib绘图技巧的全部内容,有需要完整文档的同学欢迎留言~
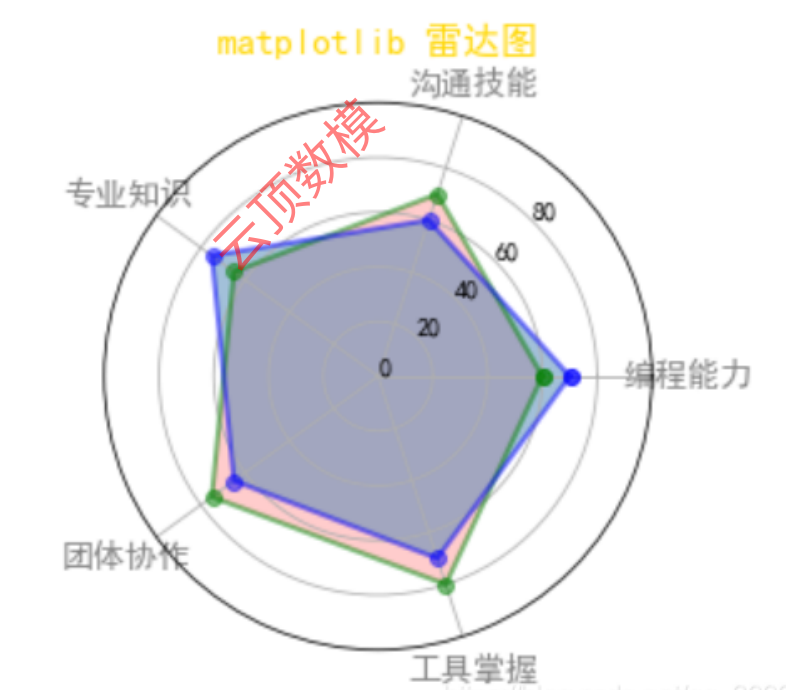
7. 雷达图
7.1 圆形雷达图
import matplotlib.pyplot as plt
import numpy as np
p1={"编程能力":60,"沟通技能":70,"专业知识":65,"团体协作":75,"工具掌握":80} #创建第一个人的数据
p2={"编程能力":70,"沟通技能":60,"专业知识":75,"团体协作":65,"工具掌握":70} #创建第二个人的数据
# 分别提取两个人的信息和对应的标签
data1=np.array([i for i in
p1.values()]).astype(int) #提取第一个人的信息
data2=np.array([i for i in
p2.values()]).astype(int) #提取第二个人的信息
label=np.array([j for j in p1.keys()]) #提取标签
angle = np.linspace(0, 2*np.pi, len(data1),
endpoint=False) #data里有几个数据,就把整圆360°分成几份
# 闭合的目的是在绘图时能够生成闭合的环
angles = np.concatenate((angle, [angle[0]])) #增加第一个angle到所有angle里,以实现闭合
data1 = np.concatenate((data1, [data1[0]])) #增加第一个人的第一个data到第一个人所有的data里,以实现闭合
data2 = np.concatenate((data2, [data2[0]])) #增加第二个人的第一个data到第二个人所有的data里,以实现闭合
fig = plt.figure()
ax = fig.add_subplot(111, polar=True) # 设置坐标轴为极坐标
# 绘制两个数据样本的闭合环
ax.plot(angles, data1, 'bo-', linewidth=2,
color='green', alpha=0.5)
ax.fill(angles, data1, facecolor='red',
alpha=0.2)
ax.plot(angles, data2, 'bo-', linewidth=2,
color='blue', alpha=0.5) #
ax.fill(angles, data2, facecolor='steelblue',
alpha=0.5)
# 设置圆周每一维上显示的样本
ax.set_thetagrids(angles * 180/np.pi, label,
fontproperties='SimHei', color='gray',
fontsize=13)
# 设置在半径方向上要显示的文本和显示文本的角度
ax.set_rgrids(np.arange(0, 81, 20),angle=45)
ax.set_rlim(0, 100)
ax.set_title('matplotlib 雷达图', va='bottom',
fontproperties='SimHei', color='gold',
fontsize=15)
#help(ax.set_thetagrids)
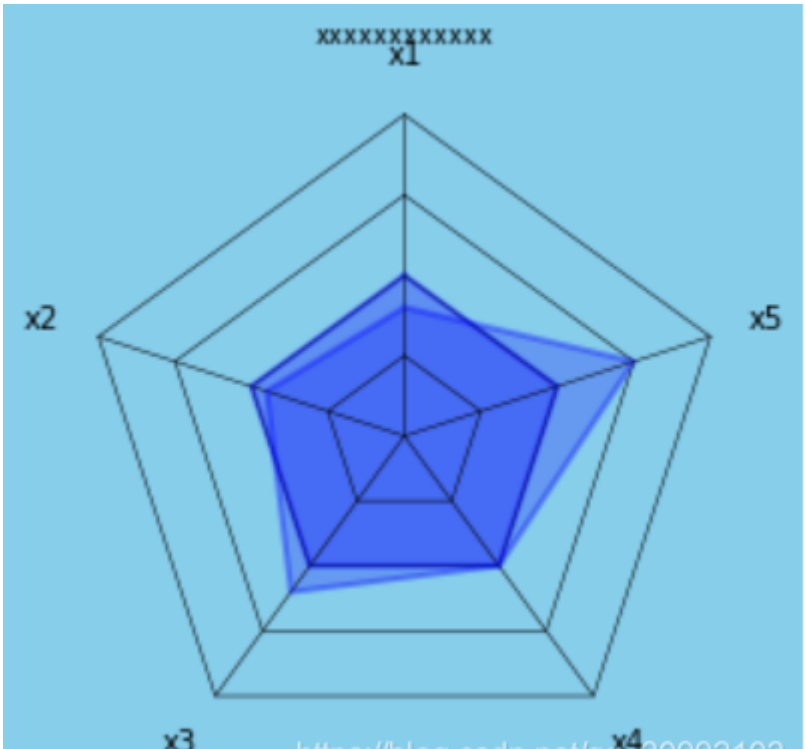
7.2 多边形雷达图
import numpy as np
import matplotlib.pyplot as plt
def plot_radar(data):
criterion = [1, 1, 1, 1, 1, 1] # 基准雷达图
angles = np.linspace(0, 2 * np.pi, 5,
endpoint=False)
angles = np.concatenate((angles, [angles[0]]))
#print(criterion)
#print(angles)
fig = plt.figure(facecolor='#87CEEB') # 创建画板
并填充颜色
ax = fig.add_subplot(111, polar=True,) # 设置
坐标为极坐标
# 绘制三个五边形
floor = 0
ceil = 2
labels = np.array(['x1', 'x2', 'x3', 'x4',
'x5'])
# 绘制五边形的循环
for i in np.arange(floor, ceil + 0.5 ,0.5):
ax.plot(angles, [i] * (6), '-', lw= 0.5,
color='black')
for i in range(5):
ax.plot([angles[i], angles[i]], [floor,
ceil], '-',lw=0.5, color='black')
# 绘制雷达图
ax.plot(angles, criterion, 'b-', lw=2,
alpha=0.4)
ax.fill(angles, criterion, facecolor='b',
alpha=0.3) #填充
ax.plot(angles, data, 'b-', lw=2, alpha=0.35)
ax.fill(angles, data, facecolor='b',
alpha=0.25)
ax.set_thetagrids(angles * 180 / np.pi,
labels)
ax.spines['polar'].set_visible(False)#不显示极坐最外的圆形
ax.set_theta_zero_location('N')#设置极坐标的起点(即0度)在正上方向
ax.grid(False)# 不显示分隔线
ax.set_yticks([]) # 不显示坐标间隔
ax.set_title('xxxxxxxxxxxx', va='bottom',
fontproperties='SimHei')
ax.set_facecolor('#87ceeb') # 填充绘图区域的颜色
# 保存文png图片
plt.subplots_adjust(left=0.09, right=1,
wspace=0.25, hspace=0.25, bottom=0.13, top=0.91)
plt.savefig('a_1.png')
plt.show()
data = [0.8, 0.9, 1.2, 1.0, 1.5, 0.8]
plot_radar(data)
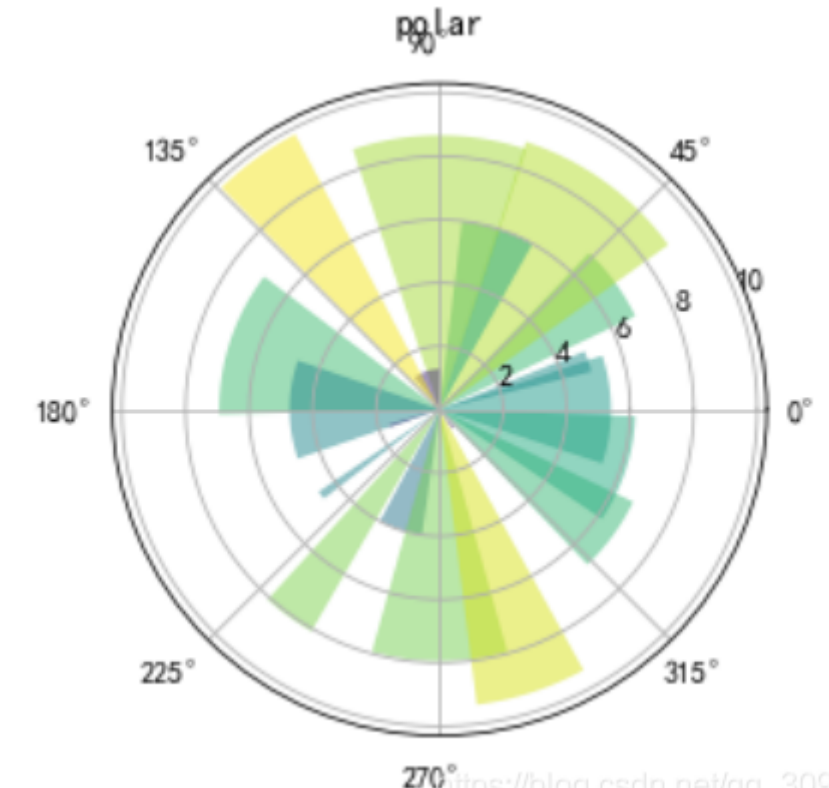
8. 极坐标图 subplot
import matplotlib.pyplot as plt
import numpy as np
N=20
theta=np.linspace(0,2*np.pi,N,endpoint=False)#均分角度
radii=10*np.random.rand(N)#随机角度
width=np.pi/4*np.random.rand(N)#随机宽度
ax=plt.subplot(111,projection='polar')#极坐标图绘制
bars=ax.bar(theta,radii,width=width,bottom=0.0)#哪个角度画,长度,扇形角度,从距离圆心0的地方开始画
for r,bar in zip(radii,bars):
bar.set_facecolor(plt.cm.viridis(r/10.0))
bar.set_alpha(0.5) #添加颜色
plt.title('polar')
plt.show()
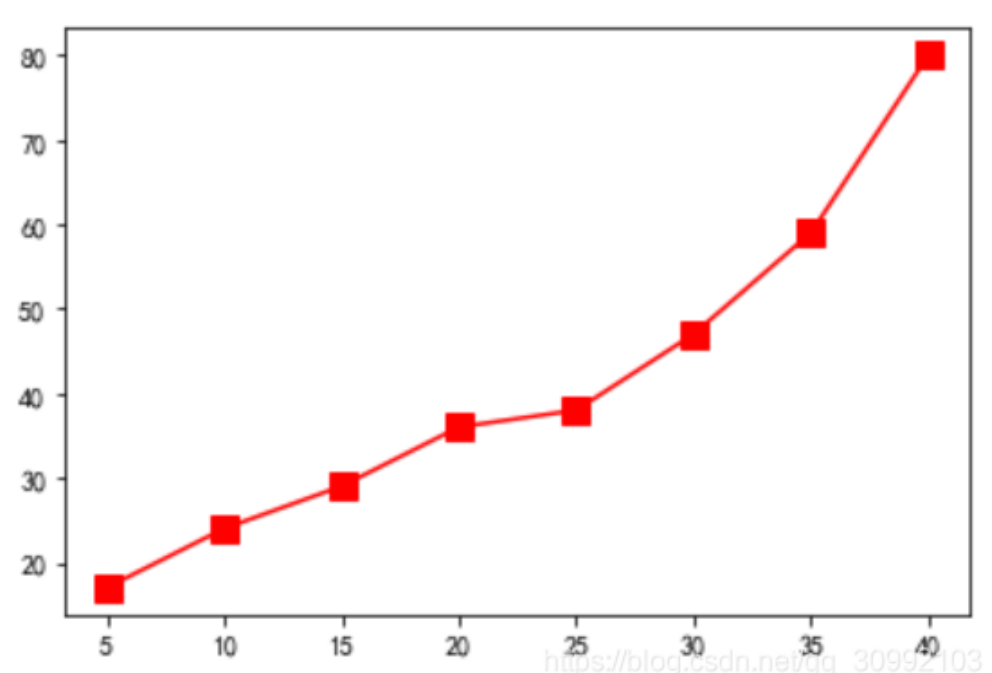
9. 折线图 plot
import matplotlib.pyplot as plt
x = [5, 10, 15, 20, 25, 30, 35, 40]
y = [17, 24, 29, 36, 38, 47, 59, 80]
plt.plot(x, y, 'rs-', markersize=10)
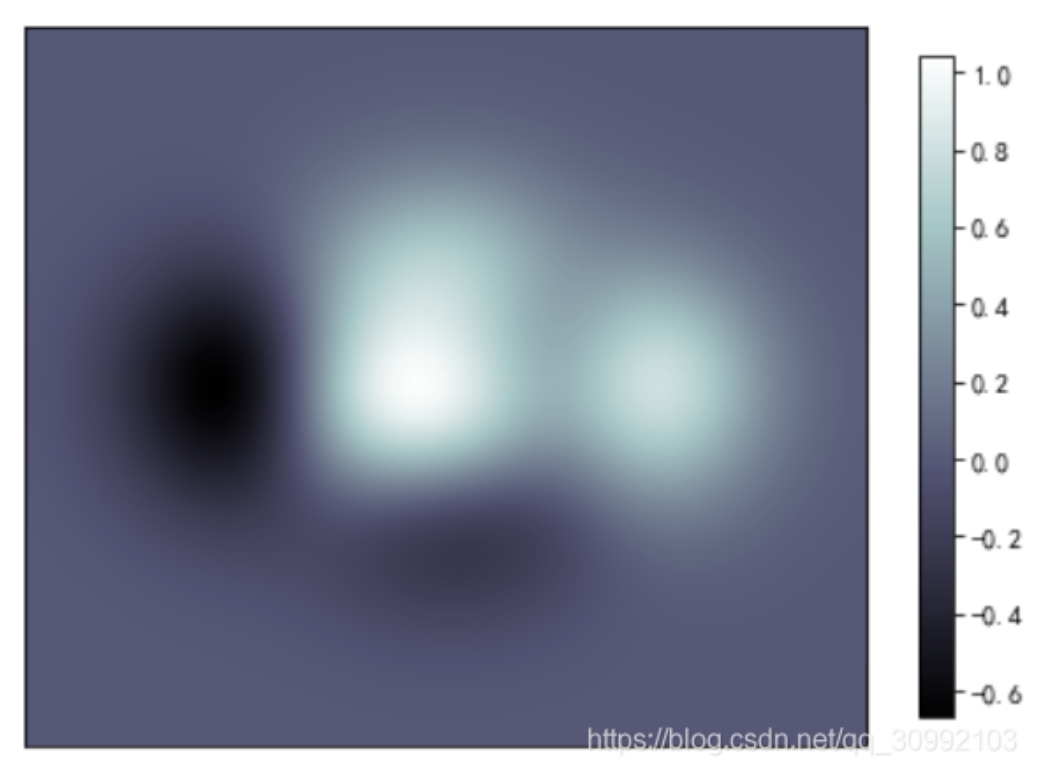
10. 灰度图 meshgrid
灰度图和热力图的区别其实在于colormap的不同,灰度图采用的灰度map,而热力图一般采用的是多个颜色组成的彩色的map。
import numpy as np
import matplotlib.pyplot as plt
def f(x,y):
return (1-x/2+x *5+y *3)*np.exp(-x *2-y *2)
n = 10
x = np.linspace(-3,3,3.5*n)
y = np.linspace(-3,3,3.0*n)
X,Y = np.meshgrid(x,y)
Z = f(X,Y)
plt.axes([0.025,0.025,0.95,0.95])
plt.imshow(Z, interpolation='bicubic',
cmap='bone', origin='lower')
plt.colorbar(shrink=0.9
plt.xticks([]), plt.yticks([])
# savefig(' ./figures/imshow_ex.png', dpi=48)
plt.show()
11. 热力图
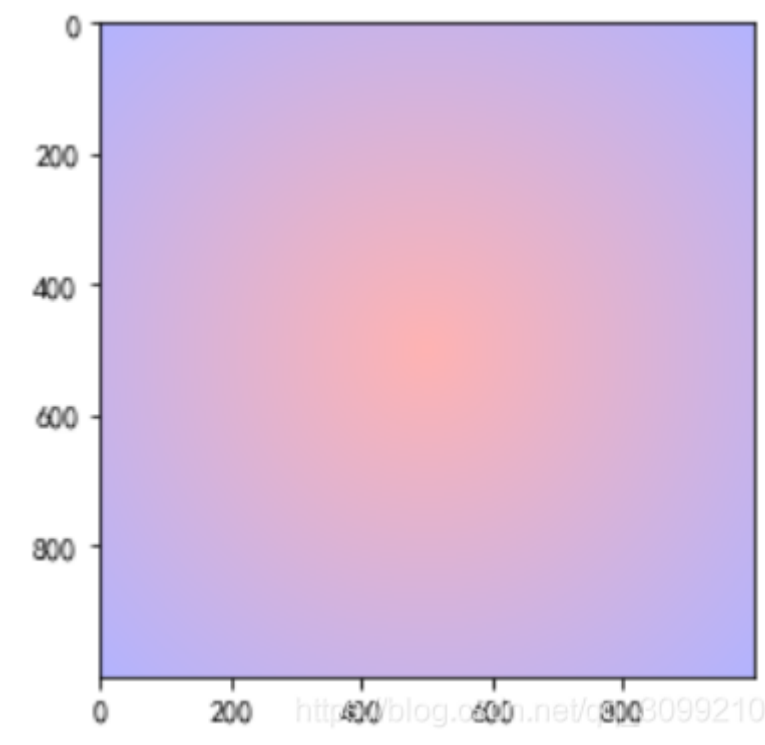
import matplotlib.pyplot as plt
import matplotlib.colors as col
import matplotlib.cm as cm
import numpy as np
points = np.arange(-5, 5, 0.01)
# print(points)
xs, ys = np.meshgrid(points, points)
z = np.sqrt(xs *2 + ys *2)
# print(z)
# 自定义colormap
start_color = 'red'
end_color = 'blue'
cmap_1 =
col.LinearSegmentedColormap.from_list('cmap1',
[start_color, end_color])
plt.imshow(z, cmap=cmap_1, alpha=0.3)
plt.show()
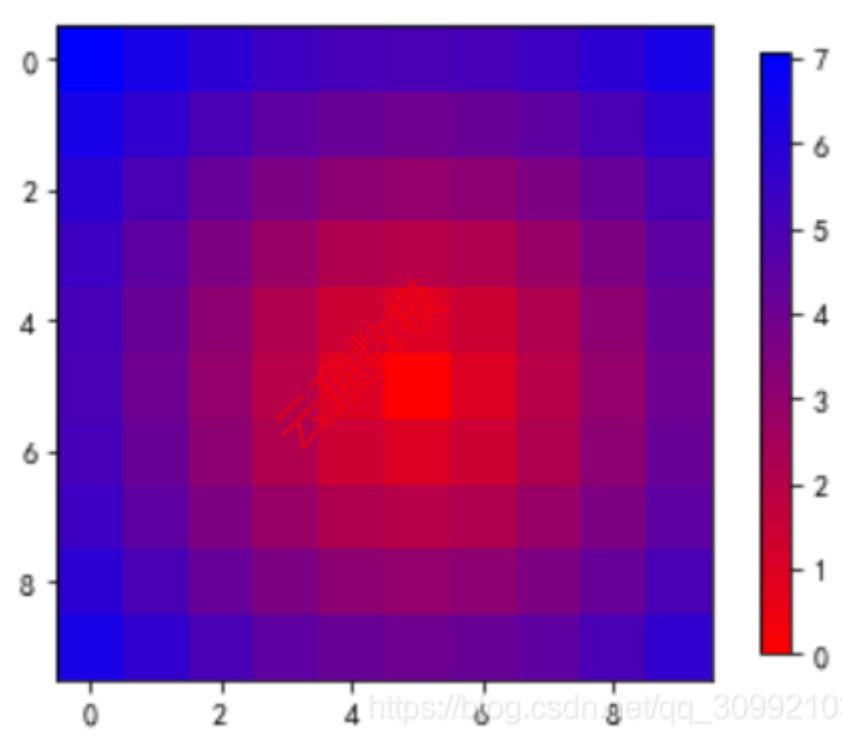
11.1 自定义colormap
import matplotlib.pyplot as plt
points = np.arange(-5, 5, 1)
# print(points)
xs, ys = np.meshgrid(points, points)
z = np.sqrt(xs *2 + ys *2)
# 列表中包含的颜色数目并不固定,可以选多个
color = ['red', 'green', 'blue']
cmap_1 =
col.LinearSegmentedColormap.from_list('cmap1',
[start_color, end_color])
plt.imshow(z, cmap=cmap_1, alpha=1)
plt.colorbar(shrink=0.92)
plt.show()
12. 箱线图 boxplot
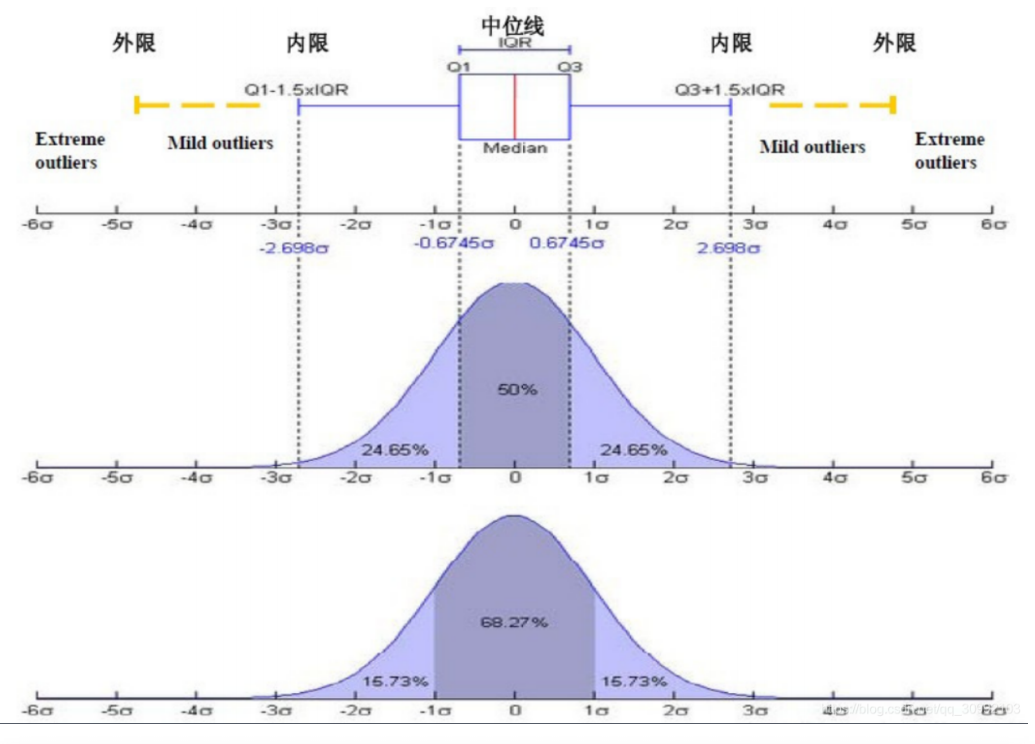
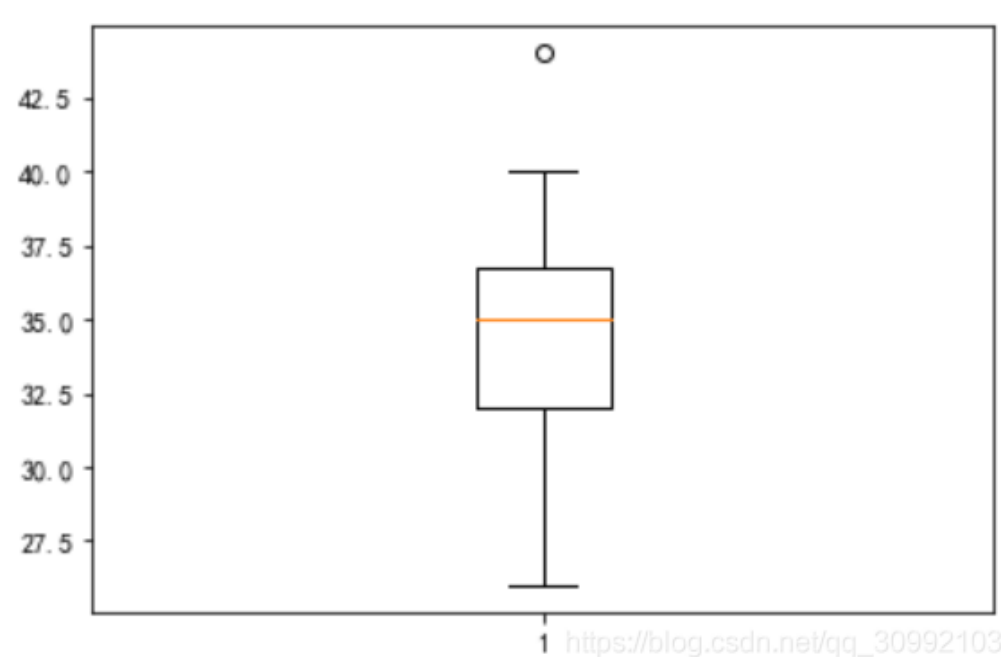
箱线图是一种用作显示一组数据分散情况的统计图
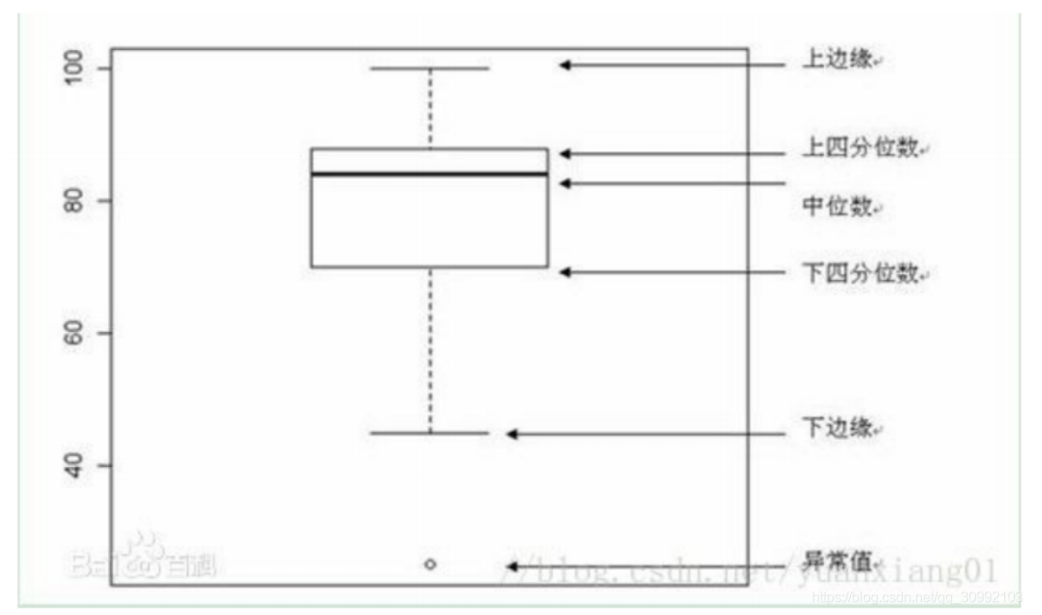
箱线图有五个参数,分别为:
- 下边缘(Q1),表示最小值;
- 下四分位数(Q2),又称“第一四分位数”,等于该样本中所有数值由小到大排列后第25%的数字;
- 中位数(Q3),又称“第二四分位数”等于该样本中所有数值由小到大排列后第50%的数字;
- 上四分位数(Q4),又称“第三四分位数”等于该样本中所有
- 数值由小到大排列后第75%的数字;
- 上边缘(Q5),表述最大值。
箱线图各参数和正态分布之间的对比如下图:
import matplotlib.pyplot as plt
import pandas as pd
import seaborn as sns
import numpy as np
# 0、导入数据集
df = pd.read_excel('boxplot_data.xlsx', 'Sheet1')
fig = plt.figure()
ax = fig.add_subplot(111)
ax.boxplot(df['Age'])
plt.show()
文章来源:https://blog.csdn.net/Magnolia_He/article/details/135307173
本文来自互联网用户投稿,该文观点仅代表作者本人,不代表本站立场。本站仅提供信息存储空间服务,不拥有所有权,不承担相关法律责任。 如若内容造成侵权/违法违规/事实不符,请联系我的编程经验分享网邮箱:chenni525@qq.com进行投诉反馈,一经查实,立即删除!
本文来自互联网用户投稿,该文观点仅代表作者本人,不代表本站立场。本站仅提供信息存储空间服务,不拥有所有权,不承担相关法律责任。 如若内容造成侵权/违法违规/事实不符,请联系我的编程经验分享网邮箱:chenni525@qq.com进行投诉反馈,一经查实,立即删除!
最新文章
- Python教程
- 深入理解 MySQL 中的 HAVING 关键字和聚合函数
- Qt之QChar编码(1)
- MyBatis入门基础篇
- 用Python脚本实现FFmpeg批量转换
- VScode右键没有go to definition选项
- MySQL修炼手册9:深入理解MySQL中ALTER命令的用法
- 实现JavaScript中的数组排序功能
- 理解文件系统
- 2023年全球软件开发大会(QCon北京站2023)2月-核心PPT资料下载
- JDBC学习笔记第十一篇
- 计价软件审计功能-鹏业云计价i20(江苏)审核技巧操作
- 如何使用科大讯飞星火大模型AI批量生成文章
- 【PostgreSQL】从零开始:(十)PostgreSQL-Createdb命令创建数据库
- this.Close(); //关闭窗体