随机漫步【scatter的使用】
发布时间:2024年01月12日
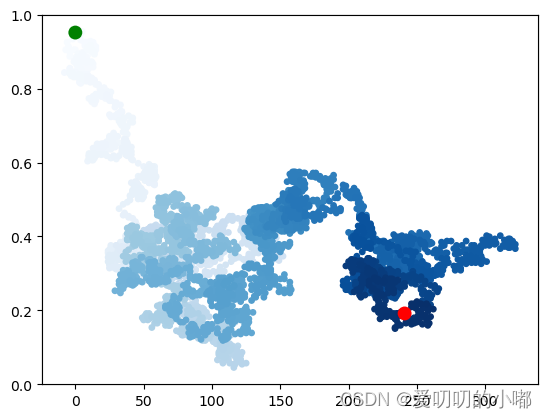
去掉scatter的坐标轴(未成功版)
import matplotlib.pyplot as plt
from random import choice
class RandomWalk():
    def __init__(self,num_points = 5000):
        self.num_points = num_points

        self.x_values = [0]
        self.y_values = [0]

    def fill_walk(self):
        while len(self.x_values) < self.num_points:
            x_direction = choice([1,-1])
            x_distance = choice([0,1,2,3,4])
            x_step = x_direction * x_distance

            y_direction = choice([1,-1])
            y_distance = choice([0,1,2,3,4])
            y_step = y_direction * y_distance

            if x_step == 0 and y_step == 0:
                continue

            next_x = self.x_values[-1] + x_step
            next_y = self.y_values[-1] + y_step
            self.x_values.append(next_x)
            self.y_values.append(next_y)
rw = RandomWalk()#类实例化
rw.fill_walk()#使用类的方法
point_numbers = list(range(rw.num_points))#生成一个从0-(rw.num_points-1)的列表
# 隐藏坐标轴 !!!这样写没有效果
plt.axes().get_xaxis().set_visible(False)
plt.axes().get_yaxis().set_visible(False)

plt.scatter(rw.x_values,rw.y_values,c = point_numbers,cmap = plt.cm.Blues , s = 15)#显示所有数据
# 要想特殊展示起点和终点,得把特殊的点再后边画
plt.scatter(0,0,c = 'green',edgecolors = 'none',s = 100)#(0,0)点以绿色加粗显示
plt.scatter(rw.x_values[-1],rw.y_values[-1],c = 'red',edgecolors='none',s = 100)#rw.x_values[-1],rw.y_values[-1]以红色加粗显示


plt.show()
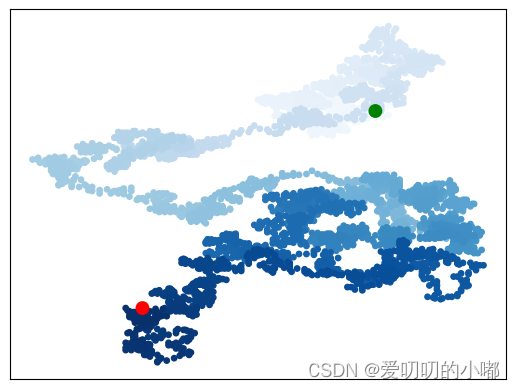
去掉scatter的坐标轴(成功版)
import matplotlib.pyplot as plt
from random import choice
class RandomWalk():
    def __init__(self,num_points = 5000):
        self.num_points = num_points

        self.x_values = [0]
        self.y_values = [0]

    def fill_walk(self):
        while len(self.x_values) < self.num_points:
            x_direction = choice([1,-1])
            x_distance = choice([0,1,2,3,4])
            x_step = x_direction * x_distance

            y_direction = choice([1,-1])
            y_distance = choice([0,1,2,3,4])
            y_step = y_direction * y_distance

            if x_step == 0 and y_step == 0:
                continue

            next_x = self.x_values[-1] + x_step
            next_y = self.y_values[-1] + y_step
            self.x_values.append(next_x)
            self.y_values.append(next_y)
rw = RandomWalk()#类实例化
rw.fill_walk()#使用类的方法
point_numbers = list(range(rw.num_points))#生成一个从0-(rw.num_points-1)的列表
# 隐藏坐标轴 隐藏坐标轴必须在scatter之前写,不然不会生效
axes = plt.axes() #得先这样写
axes.get_xaxis().set_visible(False)
axes.get_yaxis().set_visible(False)

plt.scatter(rw.x_values,rw.y_values,c = point_numbers,cmap = plt.cm.Blues , s = 15)#显示所有数据
# 要想特殊展示起点和终点,得把特殊的点再后边画
plt.scatter(0,0,c = 'green',edgecolors = 'none',s = 100)#(0,0)点以绿色加粗显示
plt.scatter(rw.x_values[-1],rw.y_values[-1],c = 'red',edgecolors='none',s = 100)#rw.x_values[-1],rw.y_values[-1]以红色加粗显示


plt.show()
文章来源:https://blog.csdn.net/L_Z_jay/article/details/135558264
本文来自互联网用户投稿,该文观点仅代表作者本人,不代表本站立场。本站仅提供信息存储空间服务,不拥有所有权,不承担相关法律责任。 如若内容造成侵权/违法违规/事实不符,请联系我的编程经验分享网邮箱:chenni525@qq.com进行投诉反馈,一经查实,立即删除!
本文来自互联网用户投稿,该文观点仅代表作者本人,不代表本站立场。本站仅提供信息存储空间服务,不拥有所有权,不承担相关法律责任。 如若内容造成侵权/违法违规/事实不符,请联系我的编程经验分享网邮箱:chenni525@qq.com进行投诉反馈,一经查实,立即删除!