xCell -- Cell Type Enrichment Analysis
目的
希望得知TCGA的每个癌种中,T cell占比分布。
或者说哪种肿瘤T cell在所有细胞中占比多(浸润的多/热肿瘤)
输入数据
gene expression matrix:HUGO gene symbols as row names and the columns are samples
-
xCell uses the expression levels ranking and not the actual values, thus normalization does not have an effect, however normalizing to gene length is required,也就是说microarray,FPKM,TPM值可以直接作为输入,但是CPM,RSEM不可以。
-
As a minimal requirement, at least 5000 genes are required to be available in the input gene expression matrix; however, low number of shared genes may affect the accuracy of the results. 也就是输入矩阵不可以是稀疏矩阵比如单细胞的转录组数据,矩阵最少有5000个基因(考虑有些样本不表达一些基因,最好是输入行多一些较好)
注意事项
- 该软件的原理也是gene expression rank list 与gene set 比较,然后得出富集分数,将富集分数进行线性转化得到一个近似的百分比数值(该数值与真实的细胞百分比可能具有很高的相关性系数也可能较低)
- 所以软件内置了一些gene symbols 用于 gene expression rank list 与gene set 比较,那使用该软进行分析时选择合适的基因注释文件对输入矩阵进行注释很重要,不然一些gene symbols对不上导致 enrichment score 不对,进而结果偏差很大哦。
- xCell uses multiple signatures for each cell type. Altogether, there are 489 signatures that correspond to the
64 cell types
#  full list of signatures
xCell.data$signatures
# 查看内部数据结构
str(xCell.data$signatures)
# 实质是 GSEAbase结构的存放方式,共489个gene set
-
rawEnrichmentAnalysis function reads a gene expression matrix and returns an enrichment score for each of the 64 cell types across the input gene expression samples.
该软件运行第一步,计算enrichment score -
For each cell type, the average of the multiple scores from the multiple corresponding signatures is calculated. Finally, average scores are shifted such that the minimal score for each cell type is zero.
这一句话的意思是说,一个cell type enrichment score 将跨越整个矩阵的列(跨样本)进行数值矫正,(我记得做GSEA分析时enrichment score是可以为负数的,可能是这个原因)将最小值转变为0,也就是整个数列偏移让最小值等于0.
当你的某个 cell type enrichment score 跨样本一样时,enrichment score会变得很小或者同时为0,所以要求样本中细胞组成占比最要多样化。 -
transformScores function is used to transform scores from raw enrichment scores to a linear scale that resembles percentages, xCell uses precomputed calibration parameters for the transformations.
这是该软件运行的第二步,将enrichment score 转化为 百分比。 -
spillOver function is used to perform the spill-over compensation applied by xCell to reduce dependency between scores of
closely related cell types. The spill over is performed using a precomputed dependency matrix ‘K‘.
这是该软件运行的第三步,说实话我没理解。
具体步骤
# install
devtools::install_github("dviraran/xCell")

# load packages
library(xCell)

# gene symbols
length(xCell.data$genes)
# gene set
str(xCell.data$signatures)

?xCellAnalysis
# xCellAnalysis(expr, signatures = NULL, genes = NULL, spill = NULL,
# rnaseq = TRUE, file.name = NULL, scale = TRUE, alpha = 0.5,
# save.raw = FALSE, parallel.sz = 4, parallel.type = "SOCK",
# cell.types.use = NULL)

# expr:	the gene expression data set. A matrix with row names as symbols and columns as samples.
# signatures:	a GMT object of signatures.
# genes:	list of genes to use in the analysis.
# spill:	the Spillover object for adjusting the scores.
# rnaseq:	if true than use RNAseq spillover and calibration paramters, else use array parameters.
# file.name:	 string for the file name for saving the scores. Default is NULL.
# scale:	 if TRUE, uses scaling to trnasform scores using fit.vals
# alpha:	 a value to override the spillover alpha parameter. Deafult = 0.5
# save.raw:	 TRUE to save a raw
# parallel.sz:	 integer for the number of threads to use. Default is 4.
# parallel.type:	 Type of cluster architecture when using snow.
# 'SOCK' or 'FORK'. Fork is faster, but is not supported in windows.
# cell.types.use:
# a character list of the cell types to use in the analysis. If NULL runs xCell with all cell types.
# The spillover compensation step may over compensate, thus it is always better to run xCell
# with a list of cell types that are expected to be in the mixture. The names of cell types
# in this list must be a subset of the cell types that are inferred by xCell.

# gene expression matrix
setwd("G:/20240103-- T cell enrichment score/")
list.files()
expr_file <- "G:/20240103-- T cell enrichment score/tcga_RSEM_gene_fpkm/tcga_RSEM_gene_fpkm"

# ananlysis own gene expression martix
exprMatrix = read.table(expr_file,header=TRUE,row.names=1, as.is=TRUE)
dim(exprMatrix)
# [1] 60498 10535
exprMatrix[1:5,1:5]
#						 TCGA.19.1787.01 TCGA.S9.A7J2.01 TCGA.G3.A3CH.11 TCGA.EK.A2RE.01 TCGA.44.6778.01
# ENSG00000242268.2           -9.966          -0.394          -9.966          -9.966          -9.966
# ENSG00000259041.1           -9.966          -9.966          -9.966          -9.966          -9.966
# ENSG00000270112.3           -4.293          -3.816          -9.966          -9.966          -6.506
# ENSG00000167578.16           4.832           4.196           3.395           3.910           4.903
# ENSG00000278814.1           -9.966          -9.966          -9.966          -9.966          -9.966
# 需要转换一下 rownames
probe <- "G:/20240103-- T cell enrichment score/tcga_RSEM_gene_fpkm/probeMap%2Fgencode.v23.annotation.gene.probemap"
probe <- read.table(probe,header=TRUE,row.names=1)
head(probe)
 #                        gene chrom chromStart chromEnd strand
# ENSG00000223972.5      DDX11L1  chr1      11869    14409      +
# ENSG00000227232.5       WASH7P  chr1      14404    29570      -
# ENSG00000278267.1    MIR6859-1  chr1      17369    17436      -
# ENSG00000243485.3 RP11-34P13.3  chr1      29554    31109      +
# ENSG00000274890.1    MIR1302-2  chr1      30366    30503      +
# ENSG00000237613.2      FAM138A  chr1      34554    36081      -
probe <- read.table(probe,header=TRUE,row.names=1)
probe <- probe[!duplicated(probe$gene),]
# sum(duplicated(probe$gene))
newrow <- rownames(probe)
exprMatrix <- exprMatrix[newrow,]
rownames(exprMatrix) <- probe$gene

# This function performs all three steps in xCell, which can be performed seperately as well:
# rawEnrichmentAnalysis
# transformScores
# spillOver
scores  <- xCellAnalysis(exprMatrix)
dim(scores)
scores[1:10,1:10]
# write.table(scores,file = "xCell_scores_TCGA_XENA.csv",sep=",")
Tcells <- rownames(scores)[grep(rownames(scores),pattern = "^CD")]
NK <- c("NK cells","NKT")
Tregs <- c("Tregs")
sub_scores <- scores[Tcells,]
dim(sub_scores)
total_Tscore <- apply(sub_scores,MARGIN = 2,sum,na.rm=TRUE)
total_Tscore <- round(total_Tscore,digits = 4)
# 读取病例信息,进行癌种分类以及可视化
list.files()
phenotype <- read.table("TCGA_phenotype_denseDataOnlyDownload.tsv",sep="\t",header = T,row.names = 1)
dim(phenotype)
head(phenotype)
table(phenotype$X_primary_disease)
patiens <- str_replace_all(colnames(sub_scores),pattern = "\\.",replacement = "-")
sub_phenotype <- phenotype[patiens,]
df <- cbind(sub_phenotype,total_Tscore)
head(df)
df <- na.omit(df)
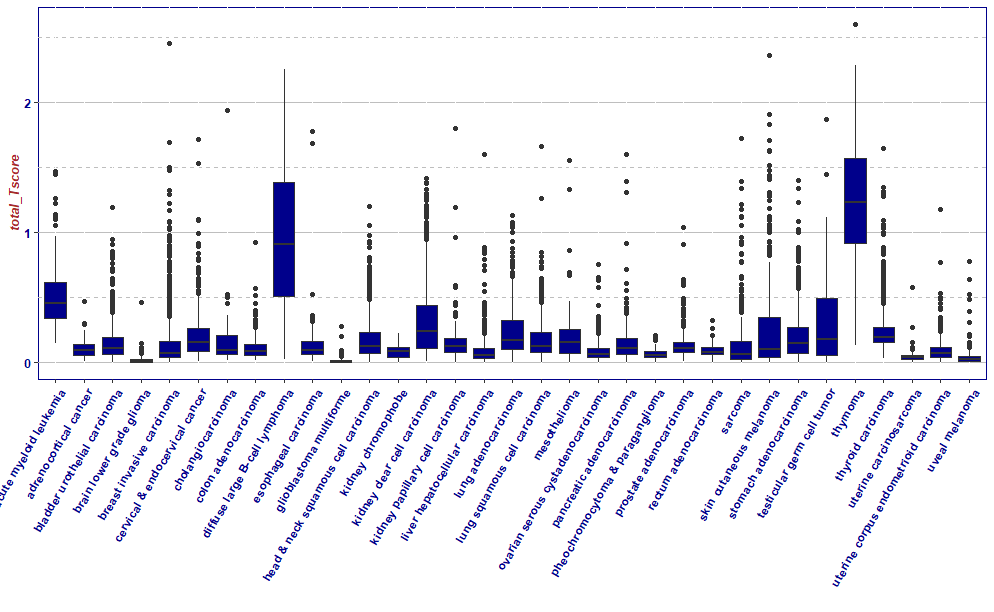
ggplot(df,aes(x = X_primary_disease,y = total_Tscore,group = X_primary_disease))+
geom_boxplot(fill="darkblue")+
xlab("")+
theme(axis.text.x = element_text(angle = 60, hjust = 1))+
mytheme
# apply(scores,MARGIN = 2,sum,na.rm=T)
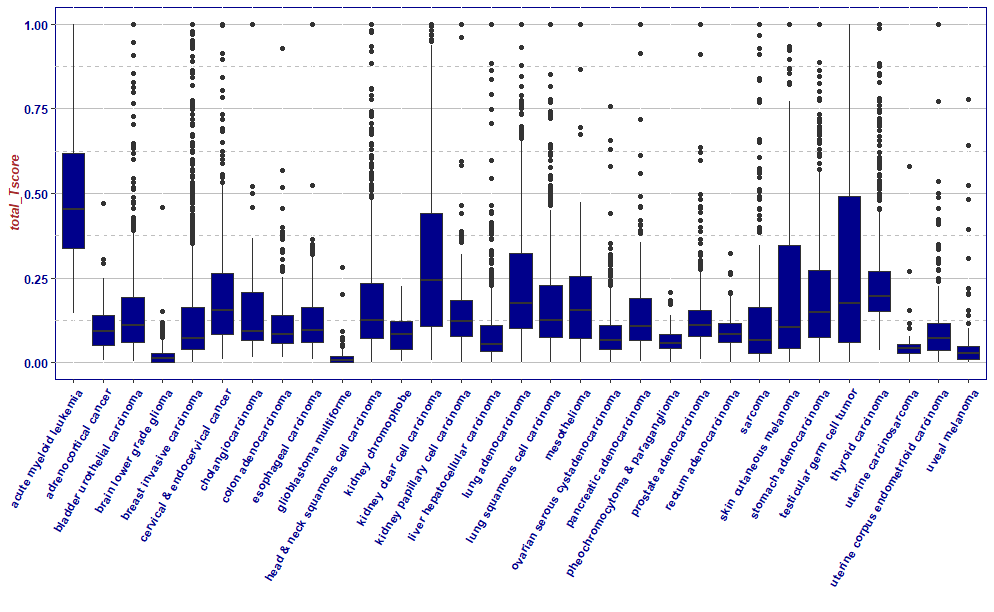
df2 <- df[df$X_primary_disease != 'diffuse large B-cell lymphoma' & df$X_primary_disease != "thymoma",]
df2[df2$total_Tscore >=1,"total_Tscore"] <- 1
ggplot(df2,aes(x = X_primary_disease,y = total_Tscore,group = X_primary_disease))+
geom_boxplot(fill="darkblue")+
xlab("")+
theme(axis.text.x = element_text(angle = 60, hjust = 1))+
mytheme
结果分析
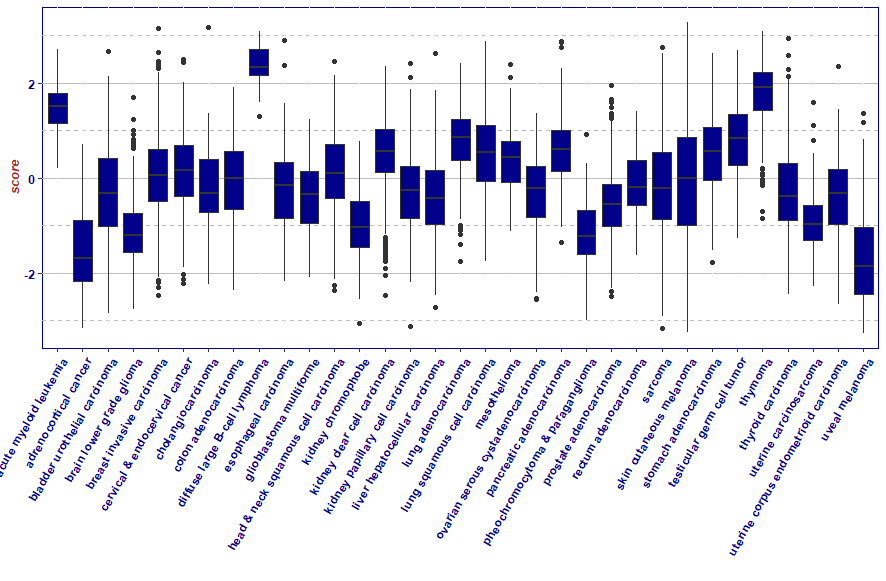
XENA 网站放了一个数据集:immune signature scores (denis
e wolf et al),可以和这个数据集相互验证一下
这个工具的结果也仅仅是有参考意义,enrichment score 是对基因表达量的一种抽象总结,enrichment score又会转化为相关性有限的百分比,基因表达量和细胞占比也仅仅是一种相关性关系,这些数据都不能真实的反应细胞分类后的统计结果。
# list.files()
xena_score <- read.table("TCGA_pancancer_10852whitelistsamples_68ImmuneSigs.xena",
                         header = T,sep="\t")
xena_score[1:10,1:10]
xena_score$X
colnames(xena_score) <- str_replace_all(colnames(xena_score),pattern = "\\.",replacement ="-")
col <- intersect(rownames(sub_phenotype),colnames(xena_score))
xena_Tscore <- xena_score[xena_score$X == "Tcell_21978456",col]
xena_Tscore <- as.data.frame(t(xena_Tscore))

xena_Tscore$cancertype <- sub_phenotype[rownames(xena_Tscore),"X_primary_disease"]
head(xena_Tscore)
colnames(xena_Tscore) <- c("score","cancertype")

ggplot(xena_Tscore,aes(x = cancertype,y = score,group = cancertype))+
  geom_boxplot(fill="darkblue")+
  xlab("")+
  theme(axis.text.x = element_text(angle = 60, hjust = 1))+
  mytheme
本文来自互联网用户投稿,该文观点仅代表作者本人,不代表本站立场。本站仅提供信息存储空间服务,不拥有所有权,不承担相关法律责任。 如若内容造成侵权/违法违规/事实不符,请联系我的编程经验分享网邮箱:chenni525@qq.com进行投诉反馈,一经查实,立即删除!
- Python教程
- 深入理解 MySQL 中的 HAVING 关键字和聚合函数
- Qt之QChar编码(1)
- MyBatis入门基础篇
- 用Python脚本实现FFmpeg批量转换
- SSR 服务器端渲染:提升用户体验的新趋势(上)
- 一键接入淘宝api:商品详情数据采集代码演示
- 镜像迁移脚本
- Springcloud 微服务实战笔记 Ribbon
- 小白也能懂之如何在自己的Windows电脑上使用QEMU虚拟机启动龙芯Loongnix系统的操作办法
- AcWing 1289. 序列的第k个数(快速幂)
- 计算机毕业设计 基于SpringBoot的高校危化试剂仓储管理系统的设计与实现 Java实战项目 附源码+文档+视频讲解
- 2024年个人站长如何选择合适的腾讯云优惠服务器?
- Sulfo-Cyanine3-Resveratrol,磺化-Cy3-白藜芦醇,具有良好光敏性的有机染料
- 基于SpringBoot和微信小程序的驾校预约平台