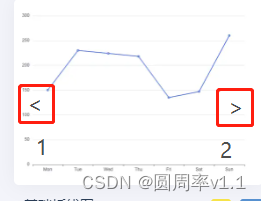
echarts通过dataZoom实现单击图像滑动
发布时间:2024年01月16日
实现原理;
1.option中配置初始化的dataZoom属性,并确定初始化数据展现位置
2.通过graphic属性配置图标及文本,并添加点击事件onclick;
3.通过dispatchAction的type: ‘dataZoom’,实现数据的最终展现。
效果:点击1图标,图像向左移一条数据,点击2图标,图像右移一条数据

  <body>
    <!-- 为 ECharts 准备一个定义了宽高的 DOM -->
    <div id="main" style="width: 400px;height:300px;"></div>
    <script type="text/javascript">
      // 基于准备好的dom,初始化echarts实例
      var myChart = echarts.init(document.getElementById('main'));
	let xData=[];
	let yData =[];
	let xdataLen = xData.length
	let startIndex=0;//开始下标
	let intervalNum= 4;//一屏展示数据条数-1,设置4,说明一屏展示数据是5条

      // 指定图表的配置项和数据
   	let	option: {
        animation:false,
        tooltip: {
          //提示框组件。
          axisPointer: {
            //选中的线条样式
            type: "line",
            lineStyle: {
              color: "rgba(85,125,231,0.1)",
              width: 10,
              type: "solid"
            }
          },
          formatter: (value) => {
          		//数据处理逻辑
           		return ....
          },
          trigger: "axis",
          backgroundColor: "rgba(0,0,0,0.4)",
          textStyle: {
            color: "#fff",
            fontWeight: "500"
          }
        },
        grid: {
          //绘图网格
          left: "0%",
          right: "5%",
          bottom: "0%",
          top: "8%",
          containLabel: true //y轴上的数值自适应,不会超出放不下
        },
        xAxis: {
          type: "category",
          data: xData,//x轴的数据,
          axisLabel: {
            interval: 0,
            formatter: (val)=> {
             //数据处理逻辑
              return 处理后的值;
            }
          },
          axisLine: {}
        },
        yAxis: {
          type: "value",
          data: yData,//y轴的数据,
          axisLabel: {
            formatter(value) {
              return 处理后的值;
            }
          },
          splitLine: {
            show: true
          }
        },
        series: [
          {
            symbolSize: 4, //圆的大小
            name: "A",
            type: "line",
            itemStyle: {
              color: "#FF8A01",
              lineStyle: {
                color: "#FF8A10"
              }
            }
          },
          {
            name: "B",
            symbolSize: 3,
            type: "line",
            itemStyle: {
              color: "#509AFE",
              lineStyle: {
                color: "#509AFE"
              }
            }
          }
        ],
        dataZoom:[
          {
            show: false,
            type: 'slider',
            xAxisIndex: 0, //设置为x轴上 此处0代表第一个x轴,也可以用数组[0]
            zoomLock: true, // 开启之后能通过鼠标左右拉动,不能滚动显示
            startValue: startIndex,  //X轴展示的开始值下标  -- 开始的值
            endValue: startIndex+intervalNum// 结束的值的下标,根据开始下标和结束下标可以控制一屏展示多少条数据,此处是展示下标为startIndex-endIndex  的数据
          }
        ],
        //graphic设置了触发点击事件的图标
        graphic:[
          {
            type: 'group',
            left: 30,
            top: 'center',
            id: 'slideStep',
            z: 100,
            onclick: ()=>{ handleGo(0) },
            children: [
              {
                type: 'rect',
                id: 'slicestep',
                left: 'center',
                top: 'middle',
                shape: {
                  width: 30,
                  height: 30,
                  r: [15],
                },
                style: {
                  fill: 'rgba(0,0,0,0.3)',
                }
              },
              {
                type: 'text',
                left: 'center',
                top: 'middle',
                style: {
                  fill: '#fff',
                  text: '<',
                  font: '20px Microsoft YaHei'
                }
              }
            ]
          },
          {
            type: 'group',
            id: 'addstep',
            right: 0,
            z: 100,
            top: 'center',
            invisible: false,
            ignore: true,
            onclick: ()=>{ handleGo(1) },
            children: [
              {
                type: 'rect',
                left: 'center',
                top: 'middle',
                shape: {
                  width: 30,
                  height: 30,
                  r: [15],
                },
                style: {
                  fill: 'rgba(0,0,0,0.3)',
                }
              },
              {
                type: 'text',
                left: 'center',
                top: 'middle',
                style: {
                  fill: '#fff',
                  text: '>',
                  font: '20px Microsoft YaHei'
                }
              }
            ]
          }
        ]
      }
		//handleGo方法是实现修改图像展示开始值、结束值
    const handleGo =(val)=>{
      if(startIndex == 0 && val ===0 || startIndex  == (xdataLen.value - 5)  && val === 1){
      }else {
        startIndex  = val === 1 ? ++startIndex  : --startIndex ;
        myChart.dispatchAction({
          type: ' ',
          dataZoomIndex: 0,
          startValue: startIndex ,
          // 结束位置的数值
          endValue: startIndex + intervalNum
        })
      }
    }
      // 使用刚指定的配置项和数据显示图表。
      myChart.setOption(option);
    </script>
  </body>
文章来源:https://blog.csdn.net/weixin_44224712/article/details/135627162
本文来自互联网用户投稿,该文观点仅代表作者本人,不代表本站立场。本站仅提供信息存储空间服务,不拥有所有权,不承担相关法律责任。 如若内容造成侵权/违法违规/事实不符,请联系我的编程经验分享网邮箱:chenni525@qq.com进行投诉反馈,一经查实,立即删除!
本文来自互联网用户投稿,该文观点仅代表作者本人,不代表本站立场。本站仅提供信息存储空间服务,不拥有所有权,不承担相关法律责任。 如若内容造成侵权/违法违规/事实不符,请联系我的编程经验分享网邮箱:chenni525@qq.com进行投诉反馈,一经查实,立即删除!