vue中echarts柱状图点击x轴数据复制
发布时间:2023年12月18日
例如柱状图如下:

步骤:
一、数据处理的时候需要在 xAxis 对象中添加:triggerEvent: true?这个键值对,以增加x轴在 @click中的事件响应
二、在图表上添加点击事件
 <v-chart ref="echarts"
:auto-resize="true"
:options="monitTimeoutStatEcharts"
@click="clickBarInBarChart"/>
?在methods中声明该方法,并且打印参数params
    clickBarInBarChart(params){
      console.log(params);
    },
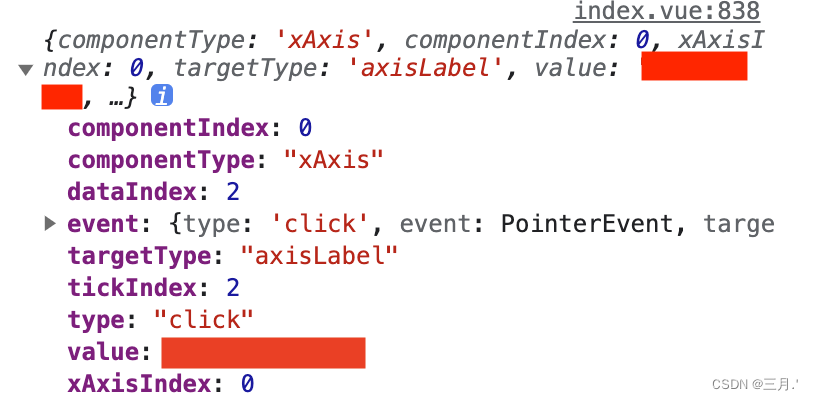
三、当我们点击x轴下方数值的时候,在控制台打印参数params,需要的值在event中找

四、复制的方法?
    async copyActivityLink(id) {
      const input = document.createElement("input");
      document.body.appendChild(input);
      input.setAttribute("value", id);
      input.select();
      if (document.execCommand("copy")) {
        document.execCommand("copy");
        this.$message.success("复制成功");
      } else {
        this.$message.error("复制失败");
      }
      document.body.removeChild(input);
    },
五、在图表对应的点击事件中调用复制方法,传递参数为你想要的参数值,即可实现复制
    clickBarInBarChart(params){
      this.copyActivityLink(params.event.target.eventData.value)
    },
文章来源:https://blog.csdn.net/qq_56715703/article/details/135068650
本文来自互联网用户投稿,该文观点仅代表作者本人,不代表本站立场。本站仅提供信息存储空间服务,不拥有所有权,不承担相关法律责任。 如若内容造成侵权/违法违规/事实不符,请联系我的编程经验分享网邮箱:chenni525@qq.com进行投诉反馈,一经查实,立即删除!
本文来自互联网用户投稿,该文观点仅代表作者本人,不代表本站立场。本站仅提供信息存储空间服务,不拥有所有权,不承担相关法律责任。 如若内容造成侵权/违法违规/事实不符,请联系我的编程经验分享网邮箱:chenni525@qq.com进行投诉反馈,一经查实,立即删除!
最新文章
- Python教程
- 深入理解 MySQL 中的 HAVING 关键字和聚合函数
- Qt之QChar编码(1)
- MyBatis入门基础篇
- 用Python脚本实现FFmpeg批量转换
- 牛客竞赛算法入门题单打卡 J Keep in Line
- K8S搭建(centos)六、搭建集群
- Android 13 动态启用或禁用IPV6
- 人生重开模拟器(c语言)
- Java基础问答题
- 在探索创意中进一步了解生成式人工智能:PartyRock —— re:Invent 2023 产品测评
- 智者的解谜:如何公平分配11头羊的故事
- PMP考试难不难,通过率怎样?
- 为什么阿里巴巴出来的架构师总是喜欢Pua人?
- 《Python数据分析技术栈》第06章使用 Pandas 准备数据 08 索引Indexing