小程序中使用echarts实现带边框雷达图
发布时间:2024年01月21日
小程序中怎么使用echarts的流程在这边文章,点击去观看
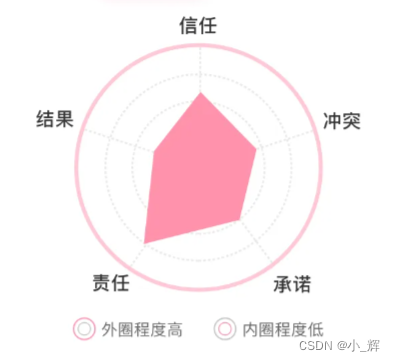
我们项目需要实现一个带边框的雷达图,看了API之后没有发现怎么去实现这个边框,所以想到了画两个雷达图来实现这个边框,具体效果如上,代码如下
  // 初始化雷达图
  init() {
    let { optionsValue } = this.data;
    function bar(canvas, width, height, dpr) {
      const chart = echarts.init(canvas, null, {
        width: width,
        height: height,
        devicePixelRatio: dpr,
      });
      canvas.setChart(chart);
      let option = {
        title: {
          text: "自定义雷达图",
        },

        radar: [
          {
            indicator: [
              { text: "信任", max: 5 },
              { text: "冲突", max: 5 },
              { text: "承诺", max: 5 },
              { text: "责任", max: 5 },
              { text: "结果", max: 5 },
            ],
            center: ["50%", "50%"],
            radius: 110,
            startAngle: 90,
            splitNumber: 4,
            shape: "circle",
            name: {
              formatter: "{value}",
              textStyle: {
                color: "#333333",
              },
            },
            // 设置区域边框和区域的颜色
            itemStyle: {
              normal: {
                color: "#FF92AC",
                lineStyle: {
                  color: "#FF92AC",
                },
              },
            },
            splitArea: {
              areaStyle: {
                color: "#fff",
                shadowColor: "rgba(0, 0, 0, 0.3)",
                // shadowBlur: 10,
              },
            },
            axisLine: {
              lineStyle: {
                color: "#E9E9E9",
                type: "dashed",
              },
            },
            splitLine: {
              lineStyle: {
                color: "#E9E9E9",
                type: "dashed",
              },
            },
          },
          {
            indicator: [
              {
                max: 100,
              },
              {
                max: 100,
              },
              {
                max: 100,
              },
              {
                max: 100,
              },
              {
                max: 100,
              },
            ],

            center: ["50%", "50%"],
            radius: 111,
            startAngle: 90,
            splitNumber: 1,
            shape: "circle",
            splitArea: {
              show: false,
            },
            axisLine: {
              show: false,
            },
            splitLine: {
              lineStyle: {
                color: "#FF92AC",
                type: "solid",
                width: 2,
              },
            },
          },
        ],
        series: [
          {
            name: "雷达图",
            type: "radar",
            silent: false,
            emphasis: {
              lineStyle: {
                width: 4,
              },
            },

            symbolSize: 0,

            data: [
              {
                value: optionsValue,
                name: "图一",
                symbol: "rect",
                areaStyle: {
                  color: "#FF92AC",
                },
                itemStyle: {
                  normal: {
                    color: "#FF92AC",
                    lineStyle: {
                      color: "#FF92AC",
                    },
                  },
                },
              },
            ],
          },
        ],
      };
      chart.setOption(option);
      return chart;
    }
    let str = "ec.onInit.br";
    let ec = { onInit: bar };
    this.setData({
      ec,
    });
  },
通过第二个雷达图跟第一个雷达图同心圆,半径比实际展示的大一点,splitNumber:1来实现一个只有外边框的雷达图
文章来源:https://blog.csdn.net/qq_42165062/article/details/135672548
本文来自互联网用户投稿,该文观点仅代表作者本人,不代表本站立场。本站仅提供信息存储空间服务,不拥有所有权,不承担相关法律责任。 如若内容造成侵权/违法违规/事实不符,请联系我的编程经验分享网邮箱:chenni525@qq.com进行投诉反馈,一经查实,立即删除!
本文来自互联网用户投稿,该文观点仅代表作者本人,不代表本站立场。本站仅提供信息存储空间服务,不拥有所有权,不承担相关法律责任。 如若内容造成侵权/违法违规/事实不符,请联系我的编程经验分享网邮箱:chenni525@qq.com进行投诉反馈,一经查实,立即删除!
最新文章
- Python教程
- 深入理解 MySQL 中的 HAVING 关键字和聚合函数
- Qt之QChar编码(1)
- MyBatis入门基础篇
- 用Python脚本实现FFmpeg批量转换
- 【升级你的Windows体验——Windows 11 Manager,你的电脑优化神器!】
- Java 常见错误 异常 说明
- AWS EKS1.26+kubesphere3.4.1
- uni-app页面数据传参方式
- java常见面试题:请解释一下Java中的常用设计模式,如单例模式、工厂模式、观察者模式等。
- DOS小白手册(DOS的基本使用)
- 三元表达式
- Java参数校验详解:使用@Valid注解和自定义注解进行参数验证
- python 判断常量和None的等值/不等 是用==/!= 还是 is/is not
- 蓝牙物联网智能安防系统设计方案