【数学建模美赛M奖速成系列】数据可视化(二)
写在前面
上一篇文章为大家分享了山脊图和气泡图的绘图方法与代码,这里学姐为继续为大家分享百分比堆叠线条图和火山图,包含matlab和python的完整代码,需要完整代码的同学看文章最后,另外,如果没有美赛经验想要获奖,欢迎咨询哦~
百分比堆叠线条图
百分比堆叠线条图是一种数据可视化工具,它结合了堆叠面积图和线条图的特点。在这种图表中,时间序列数据被分成几个部分,每个部分代表一个类别,所有类别的值加起来总和为100%。这种图的每个点的堆叠区域代表不同类别在特定时间点的百分比贡献。
优点
- 展示趋势和组成: 百分比堆叠线条图可以同时显示各个组成部分随时间变化的趋势以及它们对总量的相对贡献。
- 比较容易: 由于总量始终为100%,用户可以很容易地比较不同类别在不同时间点的相对大小。
- 节省空间:相比于多个分开的图表,一个百分比堆叠线条图能在单一视图中显示多个类别的信息。
- 视觉连续性:这种图表类型利用颜色和堆叠区域的连续性,有助于观察者追踪随时间变化的趋势。
缺点
- 局限性: 只能显示部分总和恒等于100%的数据,不适合绝对值变化很大的数据。
- 误导性: 如果某个类别的变化很大,可能会造成视觉上的误导,观察者可能认为其他类别也有相同比例的变化。
- 难以精确读取: 对于堆叠的中间部分,很难从图表中读取精确的数值,尤其是当多个类别颜色相似或者区域较小的时候。
- 顺序敏感性: 类别的堆叠顺序可能会影响读图的难易程度,一般来说,底部的类别最容易读取,而上层的则较难。
实现
在实际应用中,选择使用百分比堆叠线条图还是其他类型的图表应该基于数据的特点以及想要传达的信息。如果目标是展示多个类别随时间的相对变化,并且每个类别的总和固定,则百分比堆叠线条图是一个很好的选择。如果数据中的类别总和不是固定的,或者需要展示绝对值的变化,则可能需要选择其他类型的图表。
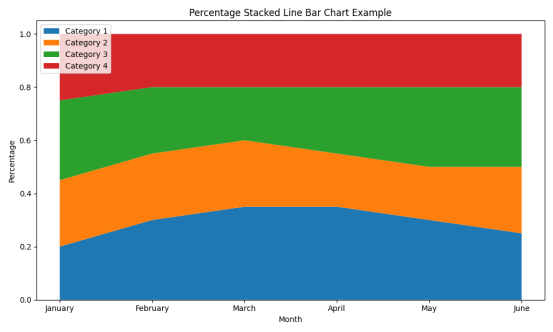
python
import matplotlib.pyplot as plt
import numpy as np

# Create sample data
categories = ['Category 1', 'Category 2', 'Category 3', 'Category 4']
months = ['January', 'February', 'March', 'April', 'May', 'June']
data = np.array([
    [20, 30, 35, 35, 30, 25], # Category 1
    [25, 25, 25, 20, 20, 25], # Category 2
    [30, 25, 20, 25, 30, 30], # Category 3
    [25, 20, 20, 20, 20, 20]  # Category 4
])

# Normalize data to sum to 1 (100%)
data_perc = data / data.sum(axis=0)

# Plot stackplot
fig, ax = plt.subplots(figsize=(10, 6))
ax.stackplot(months, data_perc, labels=categories)

# Add legend
ax.legend(loc='upper left')

# Add titles and labels
ax.set_title('Percentage Stacked Line Bar Chart Example')
ax.set_ylabel('Percentage')
ax.set_xlabel('Month')

# Display the plot
plt.tight_layout()
plt.show()
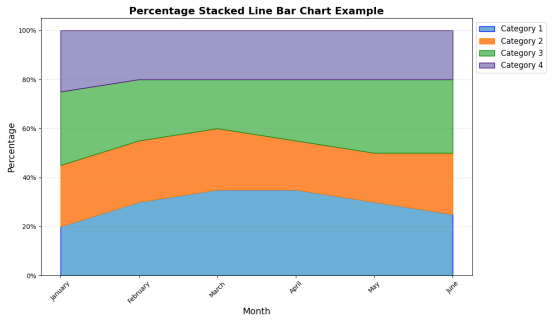
为了对百分比堆叠线条图进行了美化,使用了一组更鲜明的颜色来区分不同的类别。
在每个类别的边缘添加了更清晰的界限,添加了网格线以提高可读性,旋转了X轴标签,使它们更易读,增加了标题和轴标签的字体大小,并使标题加粗, 改进了图例的显示位置,并调整了字体大小,设置Y轴以显示百分比符号。如下所示
matlab
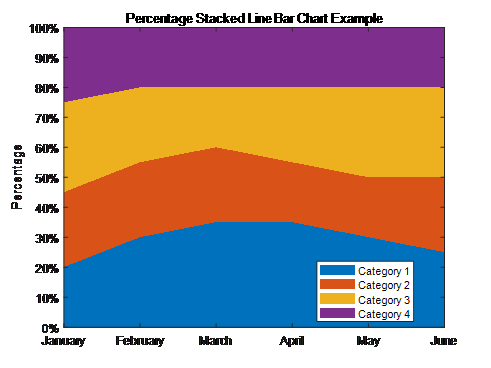
% Sample data for the four categories over six months
data = [
20 30 35 35 30 25; % Category 1
25 25 25 20 20 25; % Category 2
30 25 20 25 30 30; % Category 3
25 20 20 20 20 20 % Category 4
];

% Normalize the data to sum to 100%
data_perc = bsxfun(@rdivide, data, sum(data)) * 100;

% Create a vector to represent the months as numbers
months_num = 1:6;

% Plot the area
fig = figure;
ax = axes(fig);
stackedarea = area(ax, months_num, data_perc', 'LineStyle', 'none');

% Define the colors for each category
colors = lines(4); % Generate 4 distinct colors

% Apply the colors to the areas
for i = 1:length(stackedarea)
stackedarea(i).FaceColor = colors(i,:);
end

% Customize the axes and the plot
set(ax, 'XTick', months_num, 'XTickLabel', {'January', 'February', 'March', 'April', 'May', 'June'});
ylabel('Percentage');
title('Percentage Stacked Line Bar Chart Example');
legend({'Category 1', 'Category 2', 'Category 3', 'Category 4'}, 'Location', 'EastOutside');
grid on;

% Add Y-axis labels with percentage
yticks = get(ax, 'ytick');
new_labels = strcat(num2str(yticks'), '%');
set(ax, 'yticklabel', new_labels);
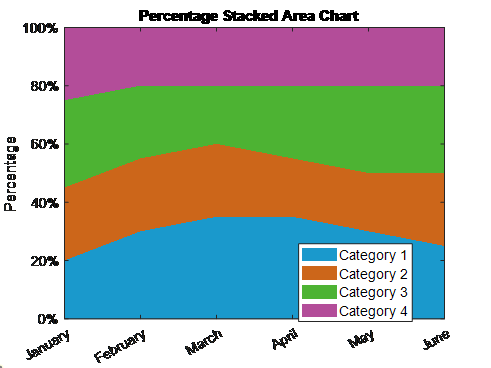
火山图
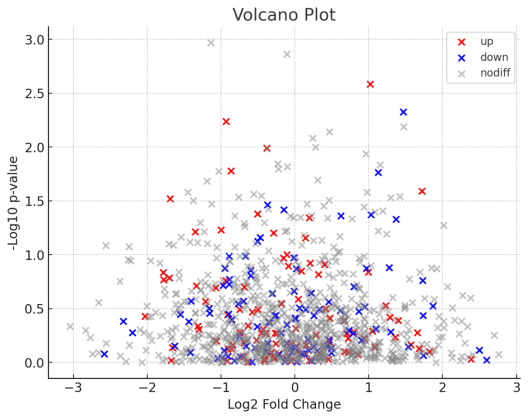
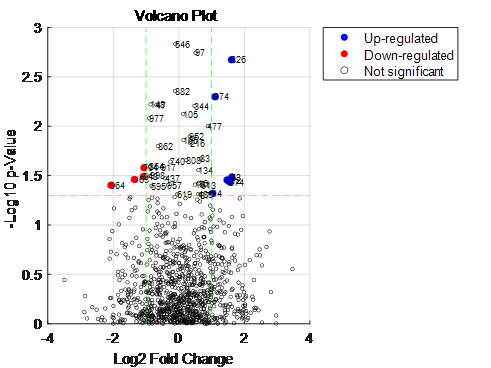
火山图是生物信息学中常用的一种图表,用来显示基因表达数据的变化。它通常将每个点表示为一个基因,x轴显示对数比率(log ratio),表示基因表达的变化大小;y轴显示-log10(p-value),表示变化的统计显著性。在火山图中,通常会看到分布在两侧的点表示表达上升或下降的基因,而分布在中间的点表示没有显著变化的基因。这种图表有助于快速识别在特定条件下显著上调或下调的基因。
火山图是一种功能强大的数据展示方法,它不仅能够显示单个基因或蛋白质的变化,还能在生物学上下文中提供这些变化的全局视图。通过这种方式,火山图帮助研究人员理解实验条件下生物学系统的整体响应。
优点
- 差异表达基因的可视化:火山图是用来直观显示成千上万个基因或蛋白质之间表达水平差异显著性的工具。每个点代表一个基因或蛋白质,它的位置基于表达变化的大小(通常是对数变化率)和这种变化的统计显著性。
- 筛选重要目标:火山图可以用来快速识别和筛选出那些表达变化最大且统计显著的基因或蛋白质。这些通常是研究中的关键分子,可能是疾病标记物或药物靶标。
- 趋势观察:通过观察点的分布,研究人员可以了解基因表达变化的总体趋势,例如是否有很多基因表达上升或下降,以及变化是否集中在某个特定区域。
- 数据质量评估:火山图也可以帮助研究人员评估实验数据的质量。理想情况下,大多数基因应该集中在图的中部,表示没有显著差异,而显著差异的基因应该均匀地分布在左右两侧。
- 交互式探索:现代生物信息学软件提供的火山图通常是交互式的,允许用户点击特定的点来获取更多关于该基因或蛋白质的信息,如名称、功能以及与其他分子的关联。
- 组合其他分析:火山图常与其他生物信息学工具和分析结合使用,比如富集分析、网络分析等,来进一步探索和解释数据中的生物学现象。
- 通信工具:作为一种强有力的视觉工具,火山图可以在学术出版物、研究报告和演示中,帮助解释复杂的统计数据,并传达研究的关键发现。
实现
python
import matplotlib.pyplot as plt
import numpy as np

# 生成示例数据
np.random.seed(0)
x = np.random.normal(size=1000)
y = -np.log10(np.random.uniform(low=0.001, high=1.0, size=1000))

# 分类条件,随机分配,仅用于示例
conditions = np.random.choice(['up', 'down', 'nodiff'], size=1000, p=[0.1, 0.1, 0.8])

# 创建火山图
plt.figure(figsize=(8, 6))
plt.scatter(x[conditions == 'up'], y[conditions == 'up'], color='r', label='up')
plt.scatter(x[conditions == 'down'], y[conditions == 'down'], color='b', label='down')
plt.scatter(x[conditions == 'nodiff'], y[conditions == 'nodiff'], color='grey', alpha=0.5, label='nodiff')

# 添加必要的标签和标题
plt.title('Volcano Plot')
plt.xlabel('Log2 Fold Change')
plt.ylabel('-Log10 p-value')

# 添加图例
plt.legend()

# 显示图表
plt.show()
matlab
% 假设数据
logFoldChange = randn(1000,1); % 随机生成对数变化倍数
pValues = rand(1000,1); % 随机生成p值

% 设置阈值
pValueThreshold = 0.05; % p值显著性阈值
logFoldChangeThreshold = 1; % 对数变化倍数阈值

% 计算统计显著性
negLogPValues = -log10(pValues); % 计算负对数p值

% 分类基因表达变化
upRegulated = logFoldChange > logFoldChangeThreshold & pValues < pValueThreshold;
downRegulated = logFoldChange < -logFoldChangeThreshold & pValues < pValueThreshold;
notRegulated = ~upRegulated & ~downRegulated;

% 绘制火山图
figure;
hold on;
scatter(logFoldChange(upRegulated), negLogPValues(upRegulated), 40,'blue', 'filled');
scatter(logFoldChange(downRegulated), negLogPValues(downRegulated), 40, 'red', 'filled');
scatter(logFoldChange(notRegulated), negLogPValues(notRegulated), 10, 'black');

% 标注显著的点
significantPoints = find(pValues < pValueThreshold);
for i = 1:length(significantPoints)
text(logFoldChange(significantPoints(i)), negLogPValues(significantPoints(i)), ...
num2str(significantPoints(i)), 'FontSize', 8);
end

% 增加参考线
line(xlim(), [-log10(pValueThreshold) -log10(pValueThreshold)], 'Color', 'green', 'LineStyle', '--');
line([-logFoldChangeThreshold -logFoldChangeThreshold], ylim(), 'Color', 'green', 'LineStyle', '--');
line([logFoldChangeThreshold logFoldChangeThreshold], ylim(), 'Color', 'green', 'LineStyle', '--');

% 添加轴标签和标题
xlabel('Log2 Fold Change');
ylabel('-Log10 p-Value');
title('Volcano Plot');

% 添加图例
legend({'Up-regulated', 'Down-regulated', 'Not significant'}, 'Location', 'northeastoutside');

% 格式化图像
set(gca, 'FontSize', 12);
grid on;
hold off;
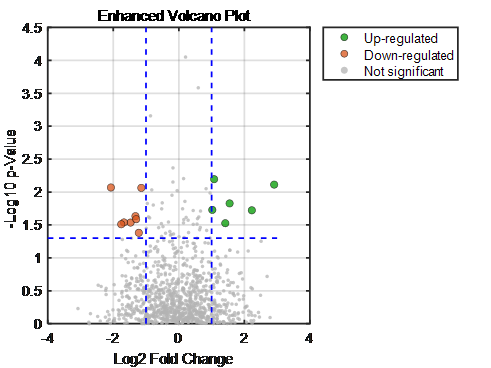
为了进一步美化,我们可以添加一些额外的格式设置,例如自定义颜色,透明度,以及改进的标注。如下所示,
最后

更多完整绘图代码可以看下面哦,可免费获取。
本文来自互联网用户投稿,该文观点仅代表作者本人,不代表本站立场。本站仅提供信息存储空间服务,不拥有所有权,不承担相关法律责任。 如若内容造成侵权/违法违规/事实不符,请联系我的编程经验分享网邮箱:chenni525@qq.com进行投诉反馈,一经查实,立即删除!
- Python教程
- 深入理解 MySQL 中的 HAVING 关键字和聚合函数
- Qt之QChar编码(1)
- MyBatis入门基础篇
- 用Python脚本实现FFmpeg批量转换
- test perf-02-性能测试之 LoadRunner LoadRunner 和 jmeter 的对比详细表格
- Java医院医疗救助系统(源码+开题)
- 智能视频监控技术在旅游业中如何发挥最大作用,助力旅游业发展
- Idea新建spring Initializr项目时选择Project SDK为1.8,选择java版本只有是17和21,出现报错信息
- 中国社科院与加拿大新跃社科联合培养博士招生简章
- 为什么有很多程序员想转产品经理?逃不过这些原因
- 2023年十篇具有影响力的人工智能研究论文
- vue3的福音框架arco.design
- MySQL夯实之路-查询性能优化深入浅出
- esp32使用lvgl,给图片取模显示图片