echarts自定义x轴和tooltip数据格式
发布时间:2024年01月18日

echarts自定义x轴和tooltip数据格式
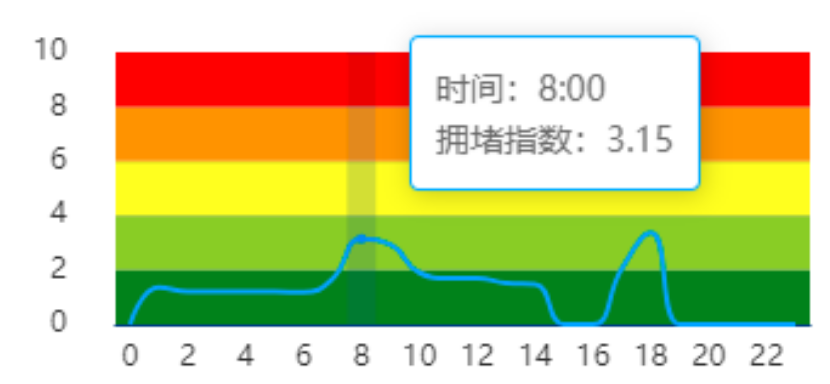
x轴和y轴数据格式如下
x: [0, 1, 2, 3, 4, 5, 6, ....., 23],
y: [2.5, 3.1, 3.2, 2.2, 2.3, 3.1, 3.1, null, null, null, .... ,null]
// 接口返回0-23点的数据,每一个小时一个间隔,没有的话则为null

修改后xy轴数据格式如下
// 每五分钟一个数据
[
        {
            "timeValue": "2024-01-18 00:00:12",
            "areaNorm": 1.0
        },
        {
            "timeValue": "2024-01-18 00:05:12",
            "areaNorm": 0.27
        },
        {
            "timeValue": "2024-01-18 00:10:11",
            "areaNorm": 1.4
        },
        {
            "timeValue": "2024-01-18 00:15:12",
            "areaNorm": 1.0
        },
        {
            "timeValue": "2024-01-18 00:20:12",
            "areaNorm": 1.0
        },
        {
            "timeValue": "2024-01-18 00:25:12",
            "areaNorm": 0.27
        },
        {
            "timeValue": "2024-01-18 00:30:12",
            "areaNorm": 0.27
        },
        {
            "timeValue": "2024-01-18 00:35:12",
            "areaNorm": 0.27
        },
        {
            "timeValue": "2024-01-18 00:40:12",
            "areaNorm": 0.27
        },
        {
            "timeValue": "2024-01-18 00:45:12",
            "areaNorm": 1.0
        },
        {
            "timeValue": "2024-01-18 00:50:12",
            "areaNorm": 1.0
        },
        {
            "timeValue": "2024-01-18 00:55:12",
            "areaNorm": 0.27
        },
        {
            "timeValue": "2024-01-18 01:00:12",
            "areaNorm": 0.27
        },
        {
            "timeValue": "2024-01-18 01:05:12",
            "areaNorm": 0.27
        },
        {
            "timeValue": "2024-01-18 01:10:12",
            "areaNorm": 0.27
        },
        {
            "timeValue": "2024-01-18 01:15:11",
            "areaNorm": 1.0
        },
        {
            "timeValue": "2024-01-18 01:20:12",
            "areaNorm": 0.27
        },
        {
            "timeValue": "2024-01-18 01:25:12",
            "areaNorm": 0.27
        },
        {
            "timeValue": "2024-01-18 01:30:12",
            "areaNorm": 0.27
        },
        {
            "timeValue": "2024-01-18 01:35:12",
            "areaNorm": 1.0
        },
        {
            "timeValue": "2024-01-18 01:40:11",
            "areaNorm": 0.27
        },
        {
            "timeValue": "2024-01-18 01:45:12",
            "areaNorm": 0.27
        },
        {
            "timeValue": "2024-01-18 01:50:12",
            "areaNorm": 1.0
        },
        {
            "timeValue": "2024-01-18 01:55:13",
            "areaNorm": 0.27
        },
        {
            "timeValue": "2024-01-18 02:00:12",
            "areaNorm": 1.0
        },
        {
            "timeValue": "2024-01-18 02:05:12",
            "areaNorm": 1.0
        },
        {
            "timeValue": "2024-01-18 02:10:12",
            "areaNorm": 1.0
        },
        {
            "timeValue": "2024-01-18 02:15:12",
            "areaNorm": 1.0
        },
        {
            "timeValue": "2024-01-18 02:20:12",
            "areaNorm": 1.0
        },
        {
            "timeValue": "2024-01-18 02:25:12",
            "areaNorm": 1.0
        },
        {
            "timeValue": "2024-01-18 02:30:12",
            "areaNorm": 1.0
        },
        {
            "timeValue": "2024-01-18 02:35:12",
            "areaNorm": 1.0
        },
        {
            "timeValue": "2024-01-18 02:40:12",
            "areaNorm": 1.0
        },
        {
            "timeValue": "2024-01-18 02:45:12",
            "areaNorm": 1.0
        },
        {
            "timeValue": "2024-01-18 02:50:12",
            "areaNorm": 1.0
        },
        {
            "timeValue": "2024-01-18 02:55:12",
            "areaNorm": 1.0
        },
        {
            "timeValue": "2024-01-18 03:00:12",
            "areaNorm": 1.0
        },
        {
            "timeValue": "2024-01-18 03:05:12",
            "areaNorm": 1.0
        },
        {
            "timeValue": "2024-01-18 03:10:12",
            "areaNorm": 0.2
        },
        {
            "timeValue": "2024-01-18 03:15:12",
            "areaNorm": 1.0
        },
        {
            "timeValue": "2024-01-18 03:20:13",
            "areaNorm": 1.0
        },
        {
            "timeValue": "2024-01-18 03:25:11",
            "areaNorm": 0.27
        },
        {
            "timeValue": "2024-01-18 03:30:12",
            "areaNorm": 0.27
        },
        {
            "timeValue": "2024-01-18 03:35:12",
            "areaNorm": 0.27
        },
        {
            "timeValue": "2024-01-18 03:40:12",
            "areaNorm": 0.27
        },
        {
            "timeValue": "2024-01-18 03:45:12",
            "areaNorm": 0.27
        },
        {
            "timeValue": "2024-01-18 03:50:12",
            "areaNorm": 1.0
        },
        {
            "timeValue": "2024-01-18 03:55:12",
            "areaNorm": 1.0
        },
        {
            "timeValue": "2024-01-18 04:00:12",
            "areaNorm": 0.87
        },
        {
            "timeValue": "2024-01-18 04:05:12",
            "areaNorm": 1.0
        },
        {
            "timeValue": "2024-01-18 04:10:12",
            "areaNorm": 0.27
        },
        {
            "timeValue": "2024-01-18 04:15:12",
            "areaNorm": 1.0
        },
        {
            "timeValue": "2024-01-18 04:20:12",
            "areaNorm": 0.87
        },
        {
            "timeValue": "2024-01-18 04:25:12",
            "areaNorm": 0.87
        },
        {
            "timeValue": "2024-01-18 04:30:12",
            "areaNorm": 1.4
        },
        {
            "timeValue": "2024-01-18 04:35:12",
            "areaNorm": 0.27
        },
        {
            "timeValue": "2024-01-18 04:40:12",
            "areaNorm": 1.0
        },
        {
            "timeValue": "2024-01-18 04:45:12",
            "areaNorm": 1.0
        },
        {
            "timeValue": "2024-01-18 04:50:12",
            "areaNorm": 1.0
        },
        {
            "timeValue": "2024-01-18 04:55:12",
            "areaNorm": 1.0
        },
        {
            "timeValue": "2024-01-18 05:00:13",
            "areaNorm": 1.0
        },
        {
            "timeValue": "2024-01-18 05:05:13",
            "areaNorm": 1.0
        },
        {
            "timeValue": "2024-01-18 05:10:12",
            "areaNorm": 0.27
        },
        {
            "timeValue": "2024-01-18 05:15:12",
            "areaNorm": 1.0
        },
        {
            "timeValue": "2024-01-18 05:20:12",
            "areaNorm": 1.0
        },
        {
            "timeValue": "2024-01-18 05:25:12",
            "areaNorm": 1.0
        }
	]
需求:
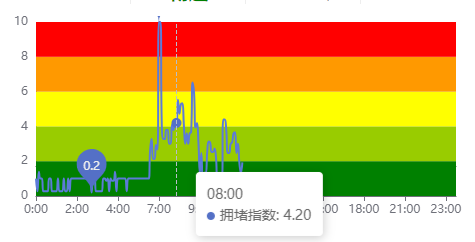
将json数据转成折线图需要的数据格式,并且x轴始终为0 - 23 点,并且折线图上的点数不会缺失,对应时间有点位的就展示,没有就空
 getChartsData(areaType, areaCode) {
      return new Promise((resolve, reject) => {
        // areaType:1 道路 2 区域
        selectDayAreaNorm({ areaType, areaCode }).then((res) => {
          if (res.code === 1) {
            this.chartsData = {
              // 初始化数据(五分钟一个点,24 * 12)
              roadNorm: Array.from({ length: 24 * 12 }, () => null), // Initialize with [null, null, ..., null]
              time: Array.from({ length: 24 * 12 }, (_, i) => i / 12), // Initialize with [0, 0.0833, ..., 23.9167]
            };
            if (res.data && res.data.length > 0) {
              res.data.forEach((item) => {
                const timeValue = new Date(item.timeValue);
                const index = Math.floor(
                  timeValue.getHours() * 12 + timeValue.getMinutes() / 5
                );
                if (index >= 0 && index < this.chartsData.time.length) {
                  this.chartsData.roadNorm[index] = item.areaNorm;
                }
              });
            }
            resolve();
          } else {
            reject();
          }
        });
      })
        .then(() => {
          if (this.chartsData) {
            this.initChartsBox();
          }
        })
        .catch((e) => {
          console.warn("Error", e);
        });
    },

    initChartsBox() {
      this.option = {
        tooltip: {
          trigger: "axis",
          axisPointer: {
            animation: false,
          },
          formatter: function (params) {
            const index = params[0].dataIndex;
            const hour = Math.floor(index / 12);
            const minute = (index % 12) * 5;
            const formattedHour = String(hour).padStart(2, "0");
            const formattedMinute = String(minute).padStart(2, "0");
            const timeStr = `${formattedHour}:${formattedMinute}`;
            const congestionIndex = params[0].value;
            const formattedIndex = congestionIndex?.toFixed(2) || "-";
            const circleIcon =
              '<span style="display:inline-block;margin-right:5px;border-radius:50%;width:8px;height:8px;background-color:#5470c6;"></span>';
            return `${timeStr}<br>${circleIcon}拥堵指数: ${formattedIndex}`;
          },
        },
        axisPointer: {
          link: {
            xAxisIndex: "all",
          },
        },
        dataZoom: [
          {
            show: false,
            realtime: true,
            start: 0,
            end: 100,
            // height: 14,
            xAxisIndex: [0, 1],
            zoomLock: true,
          },
          {
            type: "inside",
            realtime: true,
            start: 0,
            end: 100,
            xAxisIndex: [0, 1],
            zoomLock: true,
          },
        ],
        grid: [
          {
            top: 6,
            bottom: 40,
            left: 40,
            right: 40,
          },
          {
            left: 40,
            right: 40,
          },
        ],
        xAxis: [
          {
            type: "category",
            boundaryGap: false,
            axisLine: {
              onZero: true,
            },
            data: this.chartsData.time,
            axisLabel: {
              formatter: function (value, index) {
                const hour = Math.floor(value);
                return hour + ":00";
              },
            },
          },
          {
            gridIndex: 1,
          },
        ],

        yAxis: [
          {
            type: "value",
            min: 0,
            max: 10,
            // name: '时间:',
          },
          {
            gridIndex: 1,
          },
        ],
        series: [
          {
            name: "拥堵指数",
            type: "line",
            smooth: true,
            symbol: "circle",
            symbolSize: 9,
            showSymbol: false,
            lineStyle: {
              normal: {
                width: 2,
                color: "#5470c6",
              },
            },
            markPoint: {
              data: [
                {
                  type: "max",
                  name: "最大值",
                },
                {
                  type: "min",
                  name: "最小值",
                },
              ],
            },
            markArea: {
              silent: true,
              label: {
                normal: {
                  position: ["4%", "50%"],
                },
              },
              data: [
                [
                  {
                    // name: '畅通',
                    yAxis: 0,
                    itemStyle: {
                      color: "rgb(0, 128, 0)",
                    },
                  },
                  {
                    yAxis: 2,
                  },
                ],
                [
                  {
                    // name: '基本畅通',
                    yAxis: 2,
                    itemStyle: {
                      color: "rgb(153, 204, 0)",
                    },
                  },
                  {
                    yAxis: 4,
                  },
                ],
                [
                  {
                    // name: '轻度拥堵',
                    yAxis: 4,
                    itemStyle: {
                      color: "rgb(255, 255, 0)",
                    },
                  },
                  {
                    yAxis: 6,
                  },
                ],
                [
                  {
                    // name: '中度拥堵',
                    yAxis: 6,
                    itemStyle: {
                      color: "rgb(255, 153, 0)",
                    },
                  },
                  {
                    yAxis: 8,
                  },
                ],
                [
                  {
                    // name: '严重拥堵',
                    yAxis: 8,
                    itemStyle: {
                      color: "rgb(255, 0, 0)",
                    },
                  },
                  {
                    yAxis: 10,
                  },
                ],
              ],
            },
            // data: this.chartsData.roadNorm,
            data: this.chartsData.roadNorm.map((value, index) => ({
              value,
              time: this.chartsData.time[index],
            })), // 数据初始化(tooltip中使用formatter)
          },
        ],
      };
      this.myChart = this.$echarts.init(document.getElementById("chartsBox")); // 图标初始化
      this.myChart.setOption(this.option); // 渲染页面
      /* ECharts动态效果 */
      window.addEventListener("resize", () => {
        this.myChart.resize();
      });
    },

        mounted() {
            this.getChartsData(
                this.$store.state.monitorLeftComp.areaType,
                this.$store.state.monitorLeftComp.areaCode
            );
        }
文章来源:https://blog.csdn.net/m0_74149462/article/details/135670491
本文来自互联网用户投稿,该文观点仅代表作者本人,不代表本站立场。本站仅提供信息存储空间服务,不拥有所有权,不承担相关法律责任。 如若内容造成侵权/违法违规/事实不符,请联系我的编程经验分享网邮箱:chenni525@qq.com进行投诉反馈,一经查实,立即删除!
本文来自互联网用户投稿,该文观点仅代表作者本人,不代表本站立场。本站仅提供信息存储空间服务,不拥有所有权,不承担相关法律责任。 如若内容造成侵权/违法违规/事实不符,请联系我的编程经验分享网邮箱:chenni525@qq.com进行投诉反馈,一经查实,立即删除!
最新文章
- Python教程
- 深入理解 MySQL 中的 HAVING 关键字和聚合函数
- Qt之QChar编码(1)
- MyBatis入门基础篇
- 用Python脚本实现FFmpeg批量转换
- C# 前端GET或POST传递的两种参数body和query的区别
- python函数装饰器保存信息
- 让CHAT对springSecurity原理进行简述
- HBase查询的一些限制与解决方案
- 2024.1.17
- 二级C语言备考4
- 【Kubernetes】认证授权RBAC (一)
- likeshop开源免费商用电商系统存在任意文件上传漏洞CVE-2024-0352
- 深度解析 ThreadLocal 的多重应用场景
- 从零开始的OpenGL光栅化渲染器构建1