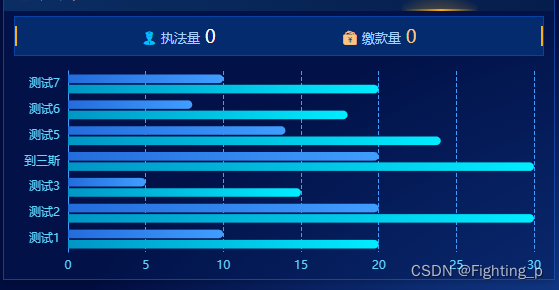
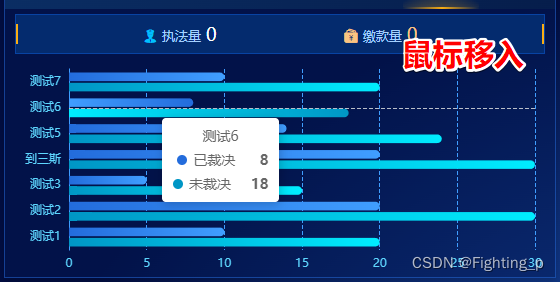
Echarts柱状图 - 柱形颜色渐变
发布时间:2024年01月15日
<!-- 违法 -->
<template>
  <div class="section">
    <div class="grid_body_top">
      <div v-for="(item, index) in topList" v-show="item.isShow" :key="index">
        <i :class="['icon', ...item.iconClass]" />
        <span class="text">{{ item.text }}</span>
        <span :class="['count', item.textClass]">{{
          $common.countFormat(infoData[item.key] || 0)
        }}</span>
      </div>
    </div>
    <div id="EchartsDom" />
  </div>
</template>

<script>
export default {
  name: 'Illegal',
  components: {},

  props: {
    select: {
      type: String,
      required: true
    },
    infoData: {
      type: Object,
      required: true
    },
    dataList: {
      type: Array,
      // required: true
      default: () => {
        return [
          { value: 10, name: '测试1', pre: '10' },
          { value: 20, name: '测试2', pre: '10' },
          { value: 5, name: '测试3', pre: '10' },
          { value: 20, name: '到三斯', pre: '10' },
          { value: 14, name: '测试5', pre: '10' },
          { value: 8, name: '测试6', pre: '10' },
          { value: 10, name: '测试7', pre: '10' }
        ]
      }
    }
  },

  data() {
    return {
      Echarts: null
    }
  },

  computed: {
    topList() {
      return [
        {
          text: '执法量',
          key: 'zfzl',
          iconClass: ['iconfont', 'ico-police', 'cyan'],
          textClass: 'white',
          isShow: this.select === 'jycx'
        },
        {
          text: '缴款量',
          key: 'yjksl',
          iconClass: ['iconfont', 'ico-qianbao', 'orange'],
          textClass: 'orange',
          isShow: this.select === 'jycx'
        },
        {
          text: '案件量',
          key: 'zfzl',
          iconClass: ['iconfont', 'ico-case', 'cyan'],
          textClass: 'white',
          isShow: this.select === 'ybcx'
        },
        {
          text: '已裁决',
          key: 'ycjzl',
          iconClass: ['icon_blue'],
          textClass: 'blue',
          isShow: this.select === 'ybcx'
        },
        {
          text: '未裁决',
          key: 'wcjzl',
          iconClass: ['icon_cyan'],
          textClass: 'cyan',
          isShow: this.select === 'ybcx'
        }
      ]
    },
    options() {
      return {
        title: {
          show: !this.dataList.length,
          text: '暂无数据',
          left: 'center',
          top: 'center',
          textStyle: {
            color: '#fff'
          }
        },
        grid: {
          top: 10,
          left: 20,
          right: 20,
          bottom: 5,
          containLabel: true
          // show: false,
        },
        tooltip: {
          trigger: 'axis',
          axisPointer: {
            // type: 'shadow'
          }
          // formatter: (params) => {
          //   const currentData = params[0]
          //   const index = params[0].dataIndex
          //   return `${currentData.name}<br>排名:${this.dataList[index].pm}<br>环比:${this.dataList[index].hb}`
          // }
        },
        xAxis: {
          axisLine: {
            show: false
          },
          axisTick: {
            show: false
          },
          axisLabel: {
            color: '#5ED7FF'
          },
          splitLine: {
            show: true, // X轴内容区域显示分隔线
            lineStyle: {
              type: 'dashed', // 分割线类型为虚线
              color: '#409EFF' // 分割线颜色
            }
          }
        },
        yAxis: {
          axisTick: {
            show: false
          },
          axisLine: {
            // show: true,
            show: !!this.dataList.length, // 根据数据判断是否展示Y轴轴线(如果只设置为true没有数据时该线依然在)
            lineStyle: {
              color: '#409EFF'
            }
          },
          axisLabel: {
            color: '#5ED7FF'
          },
          data: this.dataList.map((item) => item.name)
        },
        // dataZoom: [ // 滚动鼠标滚轮进行缩放 https://echarts.apache.org/zh/option.html#dataZoom-inside.type
        //   {
        //     type: 'inside'
        //   }
        // ],
        series: [
          {
            name: '已裁决',
            type: 'bar',
            itemStyle: {
              // 柱形颜色
              color: new this.$echarts.graphic.LinearGradient(0, 0, 1, 0, [
                { offset: 0, color: '#236CDC' },
                { offset: 1, color: '#409EFF' }
              ]),
              // 柱形边框
              borderRadius: [0, 100, 100, 0]
            },
            emphasis: {
              itemStyle: {
                // 鼠标移入柱形颜色
                color: new this.$echarts.graphic.LinearGradient(0, 0, 1, 0, [
                  { offset: 1, color: '#236CDC' },
                  { offset: 0, color: '#409EFF' }
                ])
              }
            },
            data: this.dataList.map((item) => item.value)
          },
          {
            name: '未裁决',
            type: 'bar',
            itemStyle: {
              // 柱形颜色
              color: new this.$echarts.graphic.LinearGradient(0, 0, 1, 0, [
                { offset: 0, color: '#0096C5' },
                { offset: 1, color: '#00EDFF' }
              ]),
              // 柱形边框
              borderRadius: [0, 100, 100, 0]
            },
            emphasis: {
              itemStyle: {
                // 鼠标移入柱形颜色
                color: new this.$echarts.graphic.LinearGradient(0, 0, 1, 0, [
                  { offset: 1, color: '#0096C5' },
                  { offset: 0, color: '#00EDFF' }
                ])
              }
            },
            data: this.dataList.map((item) => item.value + 10)
          }
        ]
      }
    }
  },

  watch: {
    dataList() {
      this.init()
    }
  },

  mounted() {
    window.addEventListener('resize', () => {
      if (document.getElementById('EchartsDom')) {
        this.Echarts = this.$echarts.init(document.getElementById('EchartsDom'))
        this.Echarts.resize()
      }
    })

    this.init()
  },

  created() {},

  methods: {
    init() {
      if (this.Echarts) {
        this.Echarts.dispose()
      }
      this.Echarts = this.$echarts.init(document.getElementById('EchartsDom'))

      this.Echarts.setOption(this.options)
    }
  }
}
</script>

<style lang='scss' scoped>
.section {
  height: 100%;
  overflow: hidden;
  #EchartsDom {
    height: calc(100% - 52px);
    // background-color: #fff;
  }
}
</style>
文章来源:https://blog.csdn.net/m0_53562074/article/details/135595736
本文来自互联网用户投稿,该文观点仅代表作者本人,不代表本站立场。本站仅提供信息存储空间服务,不拥有所有权,不承担相关法律责任。 如若内容造成侵权/违法违规/事实不符,请联系我的编程经验分享网邮箱:chenni525@qq.com进行投诉反馈,一经查实,立即删除!
本文来自互联网用户投稿,该文观点仅代表作者本人,不代表本站立场。本站仅提供信息存储空间服务,不拥有所有权,不承担相关法律责任。 如若内容造成侵权/违法违规/事实不符,请联系我的编程经验分享网邮箱:chenni525@qq.com进行投诉反馈,一经查实,立即删除!
最新文章
- Python教程
- 深入理解 MySQL 中的 HAVING 关键字和聚合函数
- Qt之QChar编码(1)
- MyBatis入门基础篇
- 用Python脚本实现FFmpeg批量转换
- Linux chmod命令
- (2021|CVPR,XMC-GAN,对比学习,注意力自调制)用于文本到图像生成的跨模态对比学习
- 认识css
- 计算机毕业设计------企业ERP报销管理系统、
- UGUI长按按钮的实现(技能蓄力使用)
- day55 算法训练|动态规划part15
- Pandas.DataFrame.max() 最大值 详解 含代码 含测试数据集 随Pandas版本持续更新
- 【栈】专辑
- 系统日志表结构
- CVE-2023-51385 OpenSSH ProxyCommand命令注入漏洞