el-table自定义表格数据

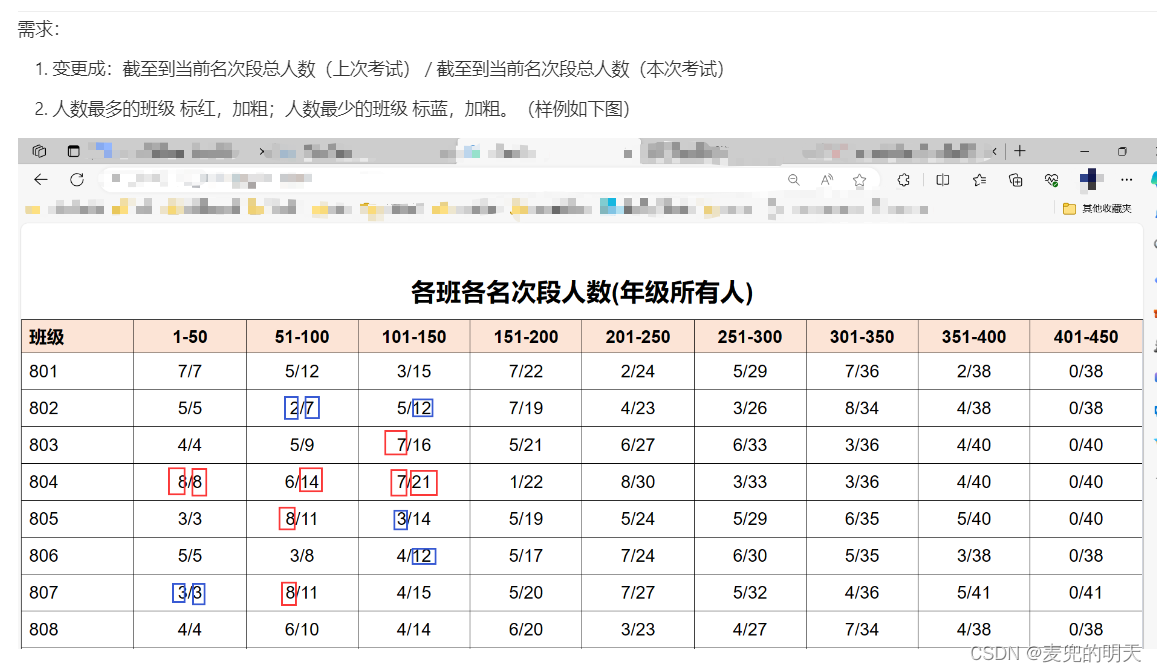
如上所示:
表格内的数据是:当前班级所在名次段的人数 /?当前班级1至n名的累计人数? ? 5/12? 也就是? 5/7+5
需要变更为:
-
截至到当前名次段总人数(上次考试) / 截至到当前名次段总人数(本次考试)
-
人数最多的班级 标红,加粗;人数最少的班级 标蓝,加粗。
?先说一下第一种的实现方式:就是用这种笨办法,也能实现
 <el-table
      :data="rankData"
      style="width: 100%"
      :header-cell-style="headerStyleEvent"
      border
      class="pptTable"
      :cell-style="cellStyle"
    >

      <el-table-column prop="l51A100" label="51-100" align="center">
        <template slot-scope="scope">
          <span>{{ scope.row.l51A100 }}/{{ scope.row.l1A50 + scope.row.l51A100 }}</span>
        </template>
      </el-table-column>

      <el-table-column prop="l401A450" label="401-450" align="center">
        <template slot-scope="scope">
          <span
            >{{ scope.row.l401A450 }}/{{
              scope.row.l1A50 +
              scope.row.l51A100 +
              scope.row.l101A150 +
              scope.row.l151A200 +
              scope.row.l201A250 +
              scope.row.l251A300 +
              scope.row.l301A350 +
              scope.row.l351A400 +
              scope.row.l401A450
            }}</span
          >
        </template>
      </el-table-column>
    </el-table>
优化后的代码:
<template>
  <div>
    <p class="pptTitle">各班各名次段人数(年级所有人)</p>
    <el-table
      :data="rankData"
      style="width: 100%"
      :header-cell-style="headerStyleEvent"
      border
      class="pptTable"
      :cell-style="cellStyle"
    >
      <el-table-column prop="classNo" label="班级"> </el-table-column>
      <el-table-column
        v-for="(item, index) in range"
        :key="index"
        :prop="item.value"
        :label="item.name"
        align="center"
      >
        <template slot-scope="scope">
          <span>{{ scope.row[item.value] }}/{{ accumulate(index, scope.$index) }}</span>
        </template>
      </el-table-column>
    </el-table>
  </div>
</template>

<script>
import { mixins } from "./mixins";
import _ from "lodash";
export default {
  mixins: [mixins],
  props: {
    rankData: {
      type: Array,
      default: () => []
    }
  },
  data() {
    return {};
    return {
      range: [
        {
          name: "1-50",
          value: "l1A50"
        },
        {
          name: "51-100",
          value: "l51A100"
        },
        {
          name: "101-150",
          value: "l101A150"
        },
        {
          name: "151-200",
          value: "l151A200"
        },
        {
          name: "201-250",
          value: "l201A250"
        },
        {
          name: "251-300",
          value: "l251A300"
        },
        {
          name: "301-350",
          value: "l301A350"
        },
        {
          name: "351-400",
          value: "l351A400"
        },
        {
          name: "401-450",
          value: "l401A450"
        }
      ]
    };
  },
  computed: {
    rankArr() {
      let newRank = _.cloneDeep(this.rankData);
      const accumulation = newRank.map(v => {
        delete v.classNo;
        return Object.values(v);
      });
      return accumulation;
    }
  },
  methods: {
    accumulate(index, columnIndex) {
      const countArr = this.rankArr[columnIndex].slice(0, index + 1);
      const sumByIndex = countArr.reduce((prev, cur, i) => {
        return prev + cur;
      }, 0);
      return sumByIndex;
    }
  }
};
</script>
<style lang="scss" scoped>
.el-table {
  border: 1px solid #000;
}
</style>
关键代码:?
computed: {
? ? rankArr() {
? ? ? let newRank = _.cloneDeep(this.rankData);
? ? ? const accumulation = newRank.map(v => {
? ? ? ? delete v.classNo;
? ? ? ? return Object.values(v);
? ? ? });
? ? ? return accumulation;
? ? }
? },
? methods: {
? ? accumulate(index, columnIndex) {
? ? ? const countArr = this.rankArr[columnIndex].slice(0, index + 1);
? ? ? const sumByIndex = countArr.reduce((prev, cur, i) => {
? ? ? ? return prev + cur;
? ? ? }, 0);
? ? ? return sumByIndex;
? ? }
? }?
页面使用?accumulate方法:
?<template slot-scope="scope">
? ? ? ? ? <span>{{ scope.row[item.value] }}/{{ accumulate(index, scope.$index) }}</span>
?</template>
以上是第一版的实现方式
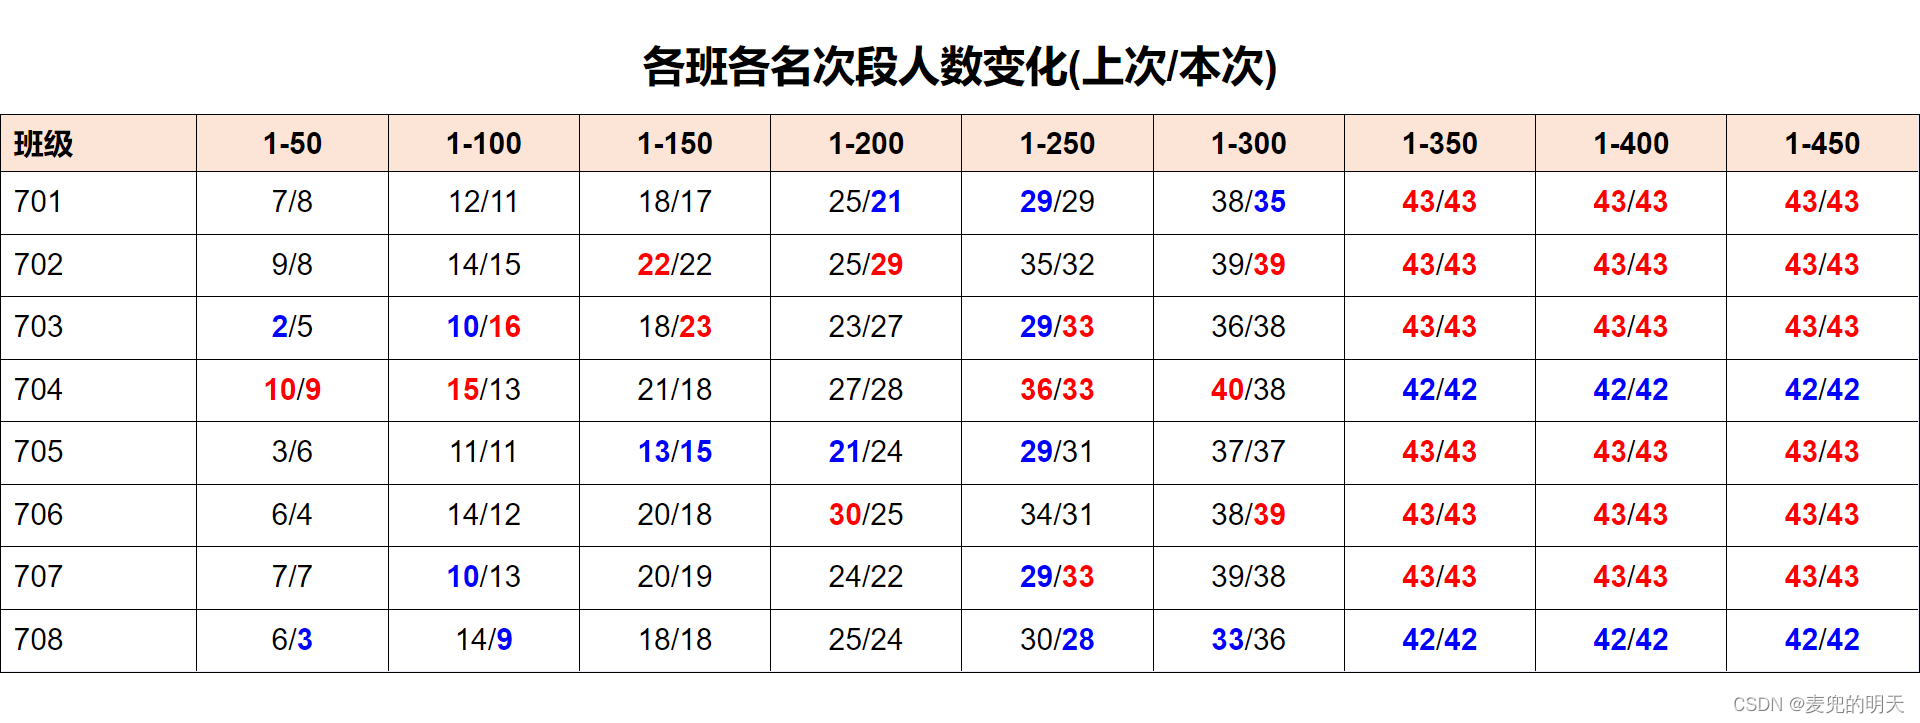
现在来说说更新需求后的实现方式:(这里稍微复杂的点在颜色)
-
截至到当前名次段总人数(上次考试) / 截至到当前名次段总人数(本次考试)
-
人数最多的班级 标红,加粗;人数最少的班级 标蓝,加粗。
<template>
  <div style="height: 100vh">
    <p class="pptTitle">各班各名次段人数变化(上次/本次)</p>
    <el-table
      :data="rankData"
      style="width: 100%"
      :header-cell-style="headerStyleEvent"
      border
      class="pptTable"
      :cell-style="cellStyle"
    >
      <el-table-column prop="classNo" label="班级"> </el-table-column>
      <el-table-column
        v-for="(item, index) in range"
        :key="index"
        :prop="item.value"
        :label="item.name"
        align="center"
      >
        <template slot-scope="scope">
          <span :style="computedStyle(scope.row[item.label], item.label)">{{
            scope.row[item.label]
          }}</span>
          <span>/</span>
          <span :style="computedStyle(scope.row[item.value], item.value)">{{
            scope.row[item.value]
          }}</span>
        </template>
      </el-table-column>
    </el-table>
  </div>
</template>

<script>
import { mixins } from "./mixins";
export default {
  mixins: [mixins],
  props: {
    rankData: {
      type: Array,
      default: () => []
    }
  },
  data() {
    return {
      range: [
        {
          name: "1-50",
          value: "before50",
          label: "previousBefore50"
        },
        {
          name: "1-100",
          value: "before100",
          label: "previousBefore100"
        },
        {
          name: "1-150",
          value: "before150",
          label: "previousBefore150"
        },
        {
          name: "1-200",
          value: "before200",
          label: "previousBefore200"
        },
        {
          name: "1-250",
          value: "before250",
          label: "previousBefore250"
        },
        {
          name: "1-300",
          value: "before300",
          label: "previousBefore300"
        },
        {
          name: "1-350",
          value: "before350",
          label: "previousBefore350"
        },
        {
          name: "1-400",
          value: "before400",
          label: "previousBefore400"
        },
        {
          name: "1-450",
          value: "before450",
          label: "previousBefore450"
        }
      ]
    };
  },

  methods: {
    // 颜色
    computedStyle(value, prop) {
      const propData = this.rankData.map(e => e[prop]);
      // console.log(value, propData, prop);

      // console.log(Math.max.apply(null, propData), "ll");
      const max = Math.max.apply(null, propData);
      const min = Math.min.apply(null, propData);
      if (value === max) {
        return { color: "red", fontWeight: "bold" };
      }

      if (value === min) {
        return { color: "blue", fontWeight: "bold" };
      }

      return {};
    }
  }
};
</script>
<style lang="scss" scoped>
.el-table {
  border: 1px solid #000;
}
</style>
?完成如下:
 ?
?
?
本文来自互联网用户投稿,该文观点仅代表作者本人,不代表本站立场。本站仅提供信息存储空间服务,不拥有所有权,不承担相关法律责任。 如若内容造成侵权/违法违规/事实不符,请联系我的编程经验分享网邮箱:chenni525@qq.com进行投诉反馈,一经查实,立即删除!