Matplotlib笔记:安装Matplotlib+常用绘图
发布时间:2024年01月23日
Matplotlib
Python的2D绘图库
安装Matplotlib
- 打开Anaconda Prompt
- 切换环境(默认是base,无需切换)
- 输入命令行安装
pip install -i https://pypi.tuna.tsinghua.edu.cn/simple matplotlib==3.5.2
绘图
导入import matplotlib.pyplot as plt
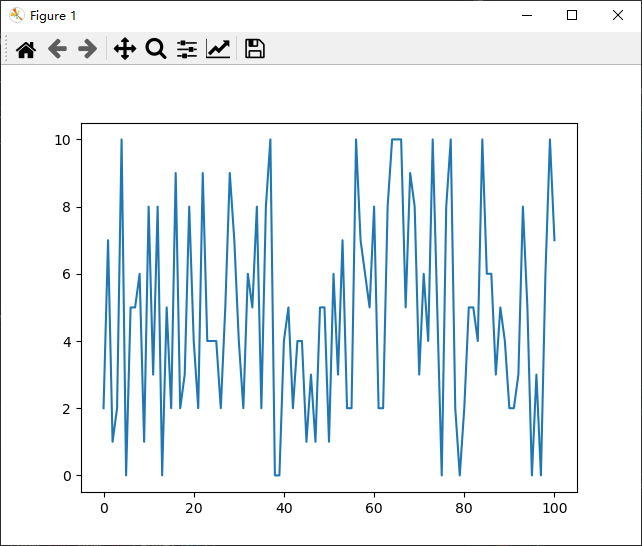
折线图
import random

import matplotlib.pyplot as plt

x = [num for num in range(101)]
y = [random.randint(0, 10) for num in range(101)]
plt.plot(x, y)
plt.savefig('./img/2.jpg')
plt.show()
饼图
import matplotlib.pyplot as plt

# 中文乱码
plt.rcParams['font.sans-serif'] = ['Microsoft YaHei']
# 构造百分比数据和标签
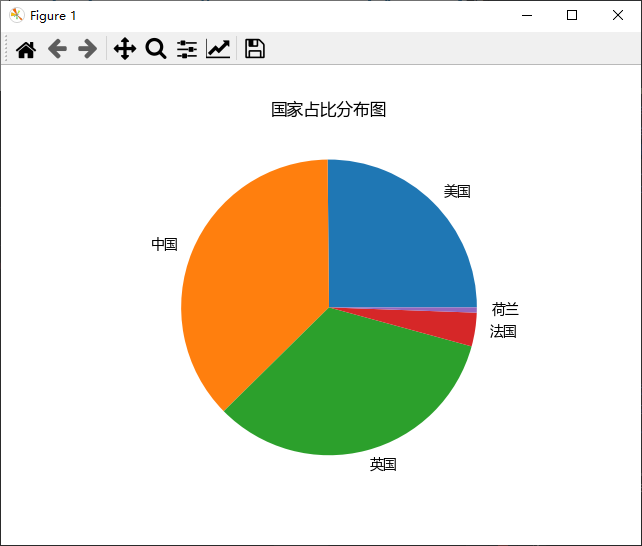
data = [0.2515, 0.3724, 0.3336, 0.0368, 0.0057]
labels = ['美国', '中国', '英国', '法国', '荷兰']
# 绘制饼图
plt.pie(x=data, labels=labels)
# 添加图标题
plt.title('国家占比分布图')
# 显示图形
plt.savefig("./img/2.jpg")
plt.show()
散点图
import matplotlib.pyplot as plt

# 定义数据
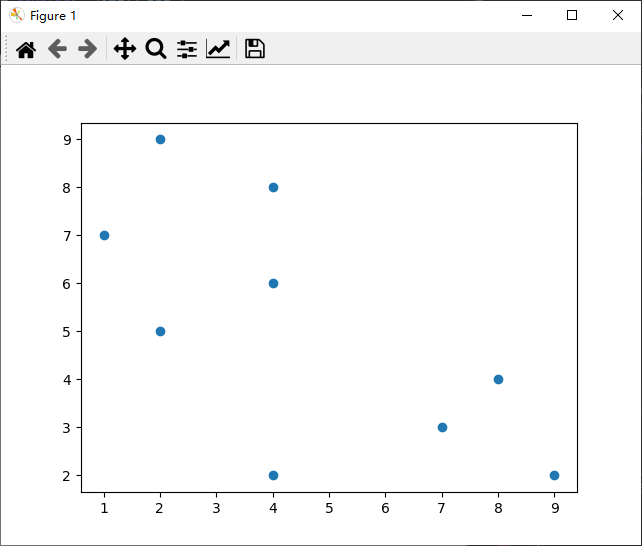
x = [2, 8, 7, 4, 4, 1, 4, 2, 9]
y = [5, 4, 3, 2, 6, 7, 8, 9, 2]
# 绘制散点图
plt.scatter(x, y)
# 显示
plt.savefig("./img/3.jpg")
plt.show()
柱状图
import matplotlib.pyplot as plt

# 设置中文和支持UTF8编码
plt.rcParams['font.sans-serif'] = ['SimHei']
# 字体大小
plt.rcParams['font.size'] = 10
# 用于解决绘图时出现负号“-”无法正常显示的问题。具体来说,该代码将参数unicode_minus设置为False,表示将使用Unicode字符来显示负号,以解决在某些操作系统或字体下负号显示为方块或其他字符的问题。该设置特别适用于中文环境,因为中文环境中常常使用到特殊字符和符号。
plt.rcParams['axes.unicode_minus'] = False
# 生成画布尺寸:20单位,8单位,dpi为单位分辨率
# figsize是Matplotlib库中figure()函数的一个参数,它控制了图形的大小,以元组形式指定,如(20,8)表示图形# 宽度为20英寸,高度为8英寸。如果没有指定,Matplotlib会使用默认值。
# dpi是图形分辨率,即每英寸点数(dots per inch),默认值为100。如果dpi为80
plt.figure(figsize=(20, 8), dpi=80)
# 横坐标电影名字
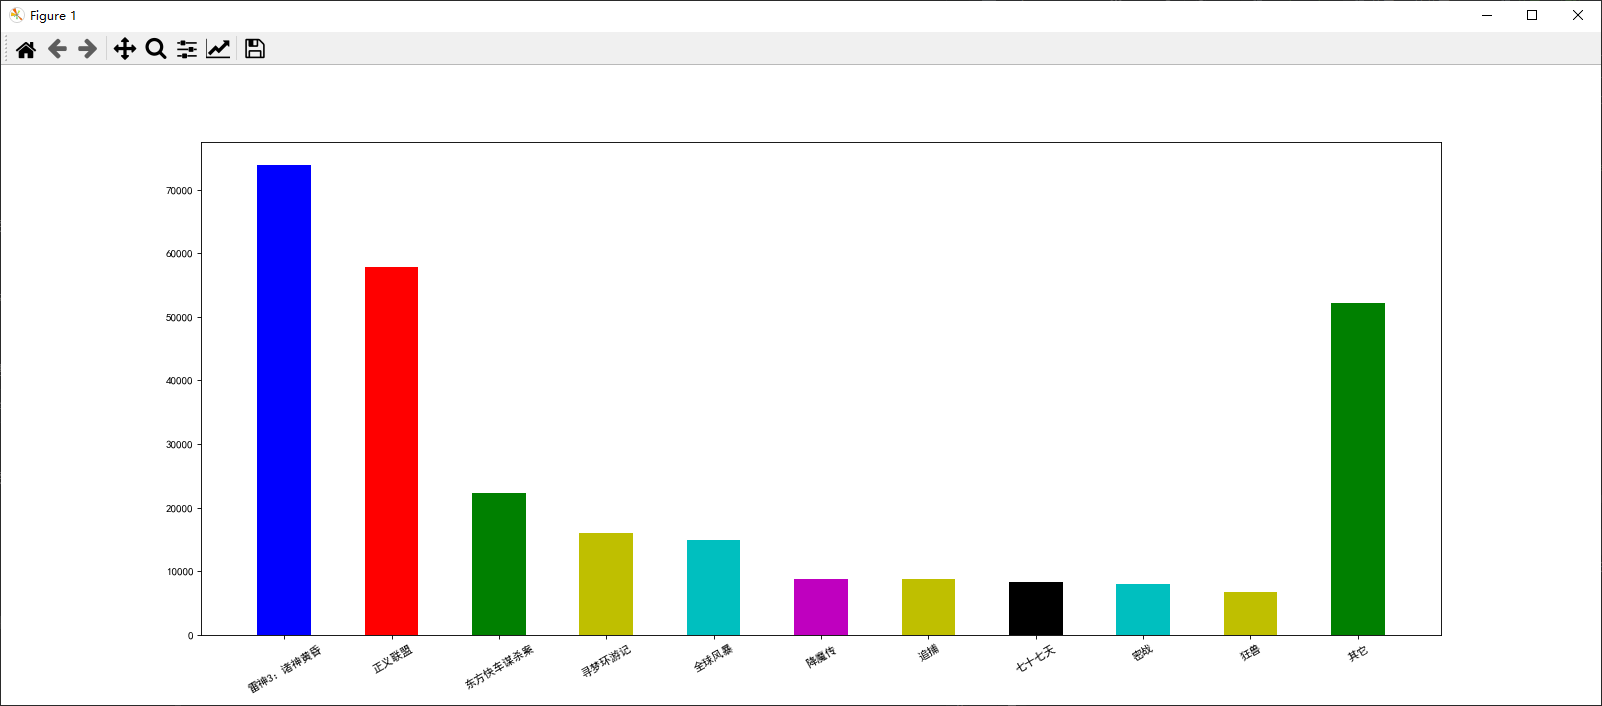
movie_name = ['雷神3:诸神黄昏', '正义联盟', '东方快车谋杀案', '寻梦环游记', '全球风暴', '降魔传', '追捕', '七十七天',
              '密战', '狂兽', '其它']
x = range(len(movie_name))
# 纵坐标票房
y = [73853, 57767, 22354, 15969, 14839, 8725, 8716, 8318, 7916, 6764, 52222]
# 绘图:x轴数,y轴数据,宽度,颜色
plt.bar(x, y, width=0.5, color=['b', 'r', 'g', 'y', 'c', 'm', 'y', 'k', 'c', 'y', 'g'])
# 设置x坐标名字为电影名字
plt.xticks(x, movie_name)
# rotation 文字显示旋转角度
plt.xticks(x, movie_name, rotation=30)
# 保存图片
plt.savefig("./img/4.jpg")
# 显示
plt.show()
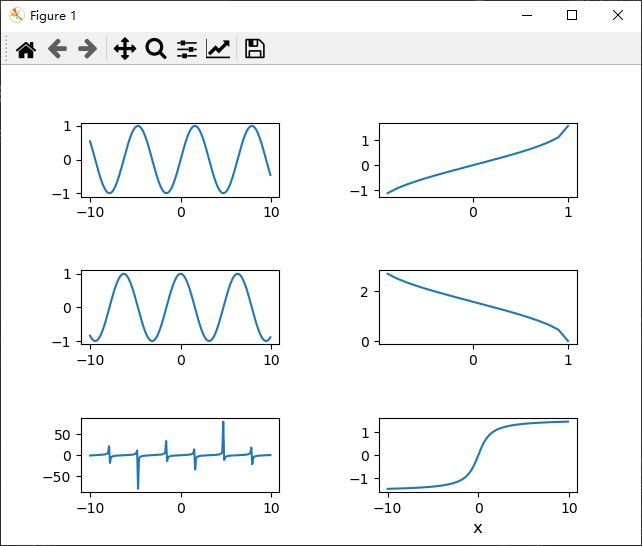
分割图形显示
GridSpec(3, 2, wspace=0.5, hspace=1)
- 参数1:图形分割显示的行数,3 行
- 参数2:图形分割显示的列数,2 列
- 参数3:wspace 子图之间水平方向的间距 0.5 个单位
- 参数4:hspace 子图之间垂直方向的间距 1 个单位
import matplotlib.pyplot as plt
import numpy as np

x = np.arange(-10, 10, 0.1)
# 正弦函数
y1 = np.sin(x)
# 余弦函数
y2 = np.cos(x)
# 正切函数
y3 = np.tan(x)
# 正弦函数
y4 = np.arcsin(x)
# 余弦函数
y5 = np.arccos(x)
# 正切函数
y6 = np.arctan(x)
# wspace=0.5 表示子图之间的水平间距为0.5个单位,这意味着相邻的子图在水平方向上会有一些空白间隙
# hspace 参数是指垂直方向的间距。在这里,hspace=1 表示子图之间的垂直间距为1个单位,
# 这意味着相邻的子图在垂直方向上会有更大的间距
grid = plt.GridSpec(3, 2, wspace=0.5, hspace=1)
plt.subplot(grid[0:1])
plt.plot(x, y1)
plt.subplot(grid[2:3])
plt.plot(x, y2)
plt.subplot(grid[4:5])
plt.plot(x, y3)
plt.subplot(grid[1:2])
plt.plot(x, y4)
plt.subplot(grid[3:4])
plt.plot(x, y5)
plt.subplot(grid[5:6])
plt.plot(x, y6)
plt.xlabel('x', fontsize=12)
plt.show()
文章来源:https://blog.csdn.net/weixin_44240478/article/details/135765913
本文来自互联网用户投稿,该文观点仅代表作者本人,不代表本站立场。本站仅提供信息存储空间服务,不拥有所有权,不承担相关法律责任。 如若内容造成侵权/违法违规/事实不符,请联系我的编程经验分享网邮箱:chenni525@qq.com进行投诉反馈,一经查实,立即删除!
本文来自互联网用户投稿,该文观点仅代表作者本人,不代表本站立场。本站仅提供信息存储空间服务,不拥有所有权,不承担相关法律责任。 如若内容造成侵权/违法违规/事实不符,请联系我的编程经验分享网邮箱:chenni525@qq.com进行投诉反馈,一经查实,立即删除!