echarts设置tooltip遇到值为0不展示的问题(已解决)
发布时间:2024年01月18日
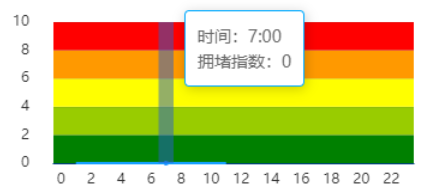
遇到值为0时
 tooltip: {
          trigger: "axis",
          extraCssText: "z-index:3",
          axisPointer: {
            type: "shadow", // 默认为直线,可选为:'line' | 'shadow'
            shadowStyle: {
              color: "rgba(41, 95, 204, 0.5)",
            },
          },
          borderColor: "rgba(0, 170, 255)", // 边框颜色
          formatter: `时间:{b}<br/>拥堵指数:{c}`
        },


        tooltip: {
          trigger: "axis",
          extraCssText: "z-index:3",
          axisPointer: {
            type: "shadow", // 默认为直线,可选为:'line' | 'shadow'
            shadowStyle: {
              color: "rgba(41, 95, 204, 0.5)",
            },
          },
          borderColor: "rgba(0, 170, 255)", // 边框颜色
          formatter: function (params) {
            return [
              "时间:" + params[0].name + ":00",
              "拥堵指数:" + [params[0].value ? params[0].value : "-"],
            ].join("<br/>");
          },
        },
完整代码如下: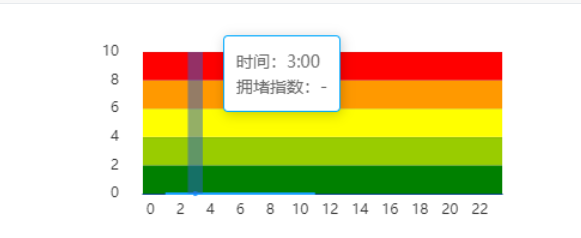
   initChartsBox() {
      this.option = {
        tooltip: {
          trigger: "axis",
          extraCssText: "z-index:3",
          axisPointer: {
            // 方法一
            type: "shadow", // 默认为直线,可选为:'line' | 'shadow'
            shadowStyle: {
              color: "rgba(41, 95, 204, 0.5)",
            },
          },
          borderColor: "rgba(0, 170, 255)", // 边框颜色
          // formatter: `时间:{b}:00<br/>拥堵指数:{c}`
          formatter: function (params) {
            return [
              "时间:" + params[0].name + ":00",
              "拥堵指数:" + [params[0].value ? params[0].value : "-"],
            ].join("<br/>");
          },
        }, // 坐标轴指示器配置
        textStyle: {
          color: "#333", // xy轴的提示文字颜色,不包含背景刻度线
        },
        color: ["#1492FF"],
        grid: {
          top: "20px",
          left: "50px",
          right: "20px",
          bottom: "25px",
        },
        xAxis: [
          {
            type: "category",
            data: this.chartsData.time,
            axisLine: {
              show: true,
              lineStyle: {
                color: "#004080",
                // width: 0,
                // type: "solid",
              }, // x轴线的颜色以及宽度
            },
            // axisLabel: {
            //   show: true,
            //   textStyle: {
            //     color: "rgba(255, 255, 255, 0.3)",
            //   }
            // }, // x轴文字的配置
            splitLine: {
              show: false,
              lineStyle: {}, // 分割线配置
            },
            axisTick: {
              show: false,
            }, // x轴的刻度线
          },
        ],
        yAxis: [
          {
            type: "value",
            max: 10,
            splitLine: {
              show: true,
              lineStyle: {
                color: "#333",
                opacity: 0.1,
              }, // 设置横向的线的颜色
            },
            axisLabel: {
              show: true,
              margin: 20,
              // textStyle: {
              //   color: "rgba(255, 255, 255, 0.3)",
              // }, // y轴的字体配置
            },

            splitArea: {
              show: true,
              areaStyle: {
                color: [
                  "rgb(0, 128, 0)",
                  "rgb(153, 204, 0)",
                  "rgb(255, 255, 0)",
                  "rgb(255, 153, 0)",
                  "rgb(255, 0, 0)",
                ],
              },
            },
          },
        ],
        series: [
          {
            data: this.chartsData.roadNorm,
            type: "line",
            smooth: true,
            symbolSize: 0, // 设置圆点大小为 0,即不显示圆点
          },
        ],
      };
      this.myChart = this.$echarts.init(document.getElementById("chartsBox")); // 图标初始化
      this.myChart.setOption(this.option); // 渲染页面
      /* ECharts动态效果 */
      window.addEventListener("resize", () => {
        this.myChart.resize();
      });
    },


    getChartsData(areaType, areaCode) {
      return new Promise((resolve, reject) => {
        // areaType:1 道路 2 区域
        get24HourAreaNorm({ areaType, areaCode }).then((res) => {
          if (res.code === 1) {
            this.chartsData = res.data;
            resolve();
          } else {
            reject();
          }
        });
      })
        .then(() => {
          if (this.chartsData) {
            this.initChartsBox();
          }
        })
        .catch((e) => {
          console.warn("Error", e);
        });
    },

        mounted() {
            this.getChartsData(areaType, areaCode)
        },
文章来源:https://blog.csdn.net/m0_74149462/article/details/135670562
本文来自互联网用户投稿,该文观点仅代表作者本人,不代表本站立场。本站仅提供信息存储空间服务,不拥有所有权,不承担相关法律责任。 如若内容造成侵权/违法违规/事实不符,请联系我的编程经验分享网邮箱:chenni525@qq.com进行投诉反馈,一经查实,立即删除!
本文来自互联网用户投稿,该文观点仅代表作者本人,不代表本站立场。本站仅提供信息存储空间服务,不拥有所有权,不承担相关法律责任。 如若内容造成侵权/违法违规/事实不符,请联系我的编程经验分享网邮箱:chenni525@qq.com进行投诉反馈,一经查实,立即删除!
最新文章
- Python教程
- 深入理解 MySQL 中的 HAVING 关键字和聚合函数
- Qt之QChar编码(1)
- MyBatis入门基础篇
- 用Python脚本实现FFmpeg批量转换
- Web前端开发中的黑客技术以及安全技术(共七种)
- 第八节TypeScript 函数
- Android--Jetpack--WorkManager详解
- Python元组与字典的基础介绍
- 财务咨询公司为何要搭建自己的线上课程平台,而非入驻其他公域流量平台
- TypeScript入门
- “Java已死、前端已凉”:是真相还是贩卖焦虑?
- Python陷阱-如何安全地删除列表元素?
- 【OCR项目】之用HALCON的深度学习工具进行文字识别,并导出到C++调用
- 深度学习:走向智能时代的引擎