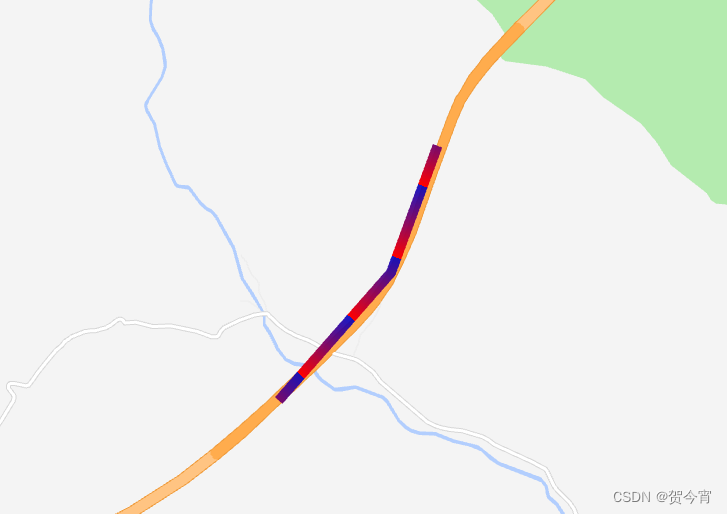
高德地图loca可视化脉冲流动线条
发布时间:2023年12月17日
<!DOCTYPE html>
<html lang="en">

<head>
    <meta charset="UTF-8" />
    <meta name="viewport" content="width=device-width, initial-scale=1.0" />
    <title>oo</title>
    <style>
        html,
        body,
        #map {
            width: 100%;
            height: 100%;
            margin: 0;
            padding: 0;
        }

        .demo-title {
            position: absolute;
            top: 25px;
            left: 25px;
            z-index: 1;
        }

        h1 {
            font-size: 18px;
            margin: 0;
            color: rgb(180, 180, 190);
        }

        h3 {
            font-size: 12px;
            font-weight: normal;
            margin-top: 5px;
            color: rgb(150, 150, 150);
        }
    </style>
</head>

<body>
    <div class="demo-title">
        <h1>北京公交线路行驶路线分类</h1>
        <h3>北京全市范围内各公交线路运行情况</h3>
    </div>
    <div id="map"></div>
    <script src="https://webapi.amap.com/maps?v=2.0&key=你的key"></script>
    <script src="https://webapi.amap.com/loca?v=2.0.0&key=你的key"></script>
    <script>
        //数据格式

        var pLineData = {
            "type": "FeatureCollection",
            "features": [
                {
                    "type": "Feature", "properties": { "type": 1 },
                    "geometry": {
                        "type": "LineString",
                        "coordinates": [[116.417458, 39.934026],]
                    }
                },
                {
                    "type": "Feature", "properties": { "type": 2 }, "geometry":
                    {
                        "type": "LineString",
                        "coordinates":
                            [[
                                126.128627,
                                41.146943
                            ],
                            [
                                126.12425,
                                41.137959
                            ],
                            [
                                126.113693,
                                41.128908
                            ]]
                    }
                },

            ]
        }
        var map = (new AMap.Map('map', {
            zoom: 11.2,
            center: [126.128627,
                41.146943],
            showLabel: false,

            mapStyle: 'amap://styles/45311ae996a8bea0da10ad5151f72979',
            pitch: 50,
        }));
        //初始化可视化
        var loca = new Loca.Container({
            map,
        });
        window._loca = loca;

        var geo = new Loca.GeoJSONSource({
            data: pLineData //数据格式
        })
//新建一个图层
        var layer = new Loca.PulseLineLayer({
            // loca,
            zIndex: 10,
            opacity: 1,
            visible: true,
            zooms: [2, 22],
        });

//填数据
        layer.setSource(geo);
        //填样式
        layer.setStyle({
            altitude: 0,
            lineWidth: 10,
            // 脉冲头颜色
            headColor: "rgb(255, 0, 0)",
            // 脉冲尾颜色
            trailColor: 'rgba(0, 0, 192, 0.9)',
            // 脉冲长度,0.25 表示一段脉冲占整条路的 1/4
            interval: 0.25,
            // 脉冲线的速度,几秒钟跑完整段路
            duration: 5000,
        });
        //添加图层开始动画
        loca.add(layer);
        loca.animate.start();
//结束


        var headColors = ['#EFBB51', '#7F3CFF', '#4CC19B', '#0B5D74', '#E06AC4', '#223F9B', '#F15C1A', '#7A0FA6'];
        // var headColors = ['#EFBB51', '#7F3CFF', '#4CC19B', '#0B5D74', '#E06AC4', '#223F9B', '#F15C1A', '#7A0FA6'];
        console.log('geo', geo);


        // 图例
        var lengend = new Loca.Legend({
            loca: loca,
            title: {
                label: '公交类型',
                fontColor: 'rgba(255,255,255,0.4)',
                fontSize: '16px'
            },
            style: {
                backgroundColor: 'rgba(255,255,255,0.1)',
                left: '20px',
                bottom: '40px',
                fontSize: '12px'
            },
            dataMap: [
                { label: 'A类型', color: headColors[7] },
                { label: 'B类型', color: headColors[6] },
                { label: 'C类型', color: headColors[5] },
                { label: 'D类型', color: headColors[4] },
                { label: 'E类型', color: headColors[3] },
                { label: 'F类型', color: headColors[2] },
                { label: 'G类型', color: headColors[1] },
                { label: 'H类型', color: headColors[0] },
            ],
        });

        loca.animate.start();
        var dat = new Loca.Dat();
        dat.addLayer(layer, '公交');

    </script>
</body>

</html>
文章来源:https://blog.csdn.net/qq_51389137/article/details/135033475
本文来自互联网用户投稿,该文观点仅代表作者本人,不代表本站立场。本站仅提供信息存储空间服务,不拥有所有权,不承担相关法律责任。 如若内容造成侵权/违法违规/事实不符,请联系我的编程经验分享网邮箱:chenni525@qq.com进行投诉反馈,一经查实,立即删除!
本文来自互联网用户投稿,该文观点仅代表作者本人,不代表本站立场。本站仅提供信息存储空间服务,不拥有所有权,不承担相关法律责任。 如若内容造成侵权/违法违规/事实不符,请联系我的编程经验分享网邮箱:chenni525@qq.com进行投诉反馈,一经查实,立即删除!
最新文章
- Python教程
- 深入理解 MySQL 中的 HAVING 关键字和聚合函数
- Qt之QChar编码(1)
- MyBatis入门基础篇
- 用Python脚本实现FFmpeg批量转换
- C语言用两个函数求最大公约数和最小公倍数
- Linux与C/C++服务器开发:深入探索网络编程与实用技术(文末送书)
- Kubernetes实战(十五)-Pod垂直自动伸缩VPA实战
- svg工厂动画
- 解决ios系统(苹果)刷新后vuex数据丢失问题
- 基于springboot代驾管理系统 可做毕业设计参考源码免费获取
- 使用HTTP/2在Linux上的Nginx服务器进行优化
- 服务器不稳定因素
- ubuntu 20.04 docker prometheus
- Jmeter基础和概念(超详细整理)