python - 等值线(contour)数值添加白色背景边框
python - 等值线(contour)数值添加白色背景边框
如下图所示,图为NCL官网实力的等值线绘图。可以观察到,图中每条等值线都带有一个白色的矩形边框,使其在黑色的等值线更加清晰明了,更具有可读性。但是,目前我还是用python比较多,希望在python中实现同样的效果。不行,再去考虑学习一下NCL进行绘图。
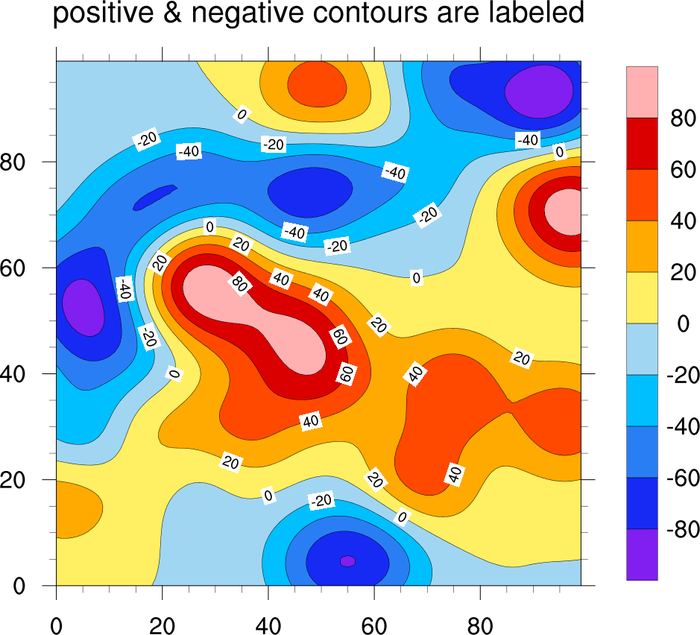
以下是实现的ncl脚本代码:
;----------------------------------------------------------------------
; conLab_8.ncl
;
; Concepts illustrated:
;   - Formatting contour line labels to force the number of digits
;   - Generating dummy data using "generate_2d_array"
;   - Making the labelbar be vertical
;   - Formatting labelbar labels using "sprintf"
;----------------------------------------------------------------------
; See tickmark example tm_8.ncl for more xxxFormat examples:
;
; http://www.ncl.ucar.edu/Applications/Images/tm_8_lg.png
;----------------------------------------------------------------------
;
; These files are loaded by default in NCL V6.2.0 and newer
; load "$NCARG_ROOT/lib/ncarg/nclscripts/csm/gsn_code.ncl"
; load "$NCARG_ROOT/lib/ncarg/nclscripts/csm/gsn_csm.ncl"

begin
;---Generate some dummy data.
  data = generate_2d_array(15, 15, -100., 100., 0, (/100,100/))

;---Contour levels to use.
  data_levels = ispan(-85,85,5) + 5.587

;---Open a png file to draw graphics to.
  wks = gsn_open_wks("png","conLab")

;---Set up resources.
  res                       = True

  res@gsnMaximize           = True

  res@cnFillOn              = True        ; Turn on contour fill
  res@cnLineLabelsOn        = True        ; Turn on contour line labels

  res@cnLevelSelectionMode = "ExplicitLevels"
  res@cnLevels             = data_levels

  res@lbOrientation        = "Vertical"

  res@tiMainString         = "Default line labels and labelbar labels"
  plot = gsn_csm_contour(wks,data,res)  ; Create filled contour plot


  res@cnLineLabelFormat    = "0@;*.3f"                      ; Only one value after decimal point
  res@lbLabelStrings       = sprintf("%5.1f",data_levels)   ; Format the labelbar labels
  res@tiMainString         = "Formatted line labels and labelbar labels"

  plot = gsn_csm_contour(wks,data,res)  ; Create filled contour plot


end
python绘制等值线
首先,在python中绘制等值线,用到的函数为plt.contour(X, Y, Z, colors='black', levels=contour.levels),为其添加等值线数值的函数为,这里需要将plt.contour(X, Y, Z, colors=‘black’, levels=contour.levels)赋值为一个变量clabels:
plt.clabel(clabels, inline=True, fontsize=8,
           fmt=fmt,
           colors='black',
           use_clabeltext=True,
           manual=False)
目前,查找了相关plt.clabel的函数,还没有找到相关的参数可以直接打开等值线数值的背景颜色,所以只能从其他方面找解决办法。首先,等值线的数值实际上就是一个个text文本,一般我们是通过matplotlib.pyplot.text(x, y, s, fontdict=None, **kwargs)来实现图上文本信息的添加的,而text本身是具备添加背景色的。所以,我们只要遍历每一个等值线上的数值文本,然后设置文本的参数即可。说起来可能有点绕,但是代码上就非常易懂:
首先生成一个等值线图片,如下所示:
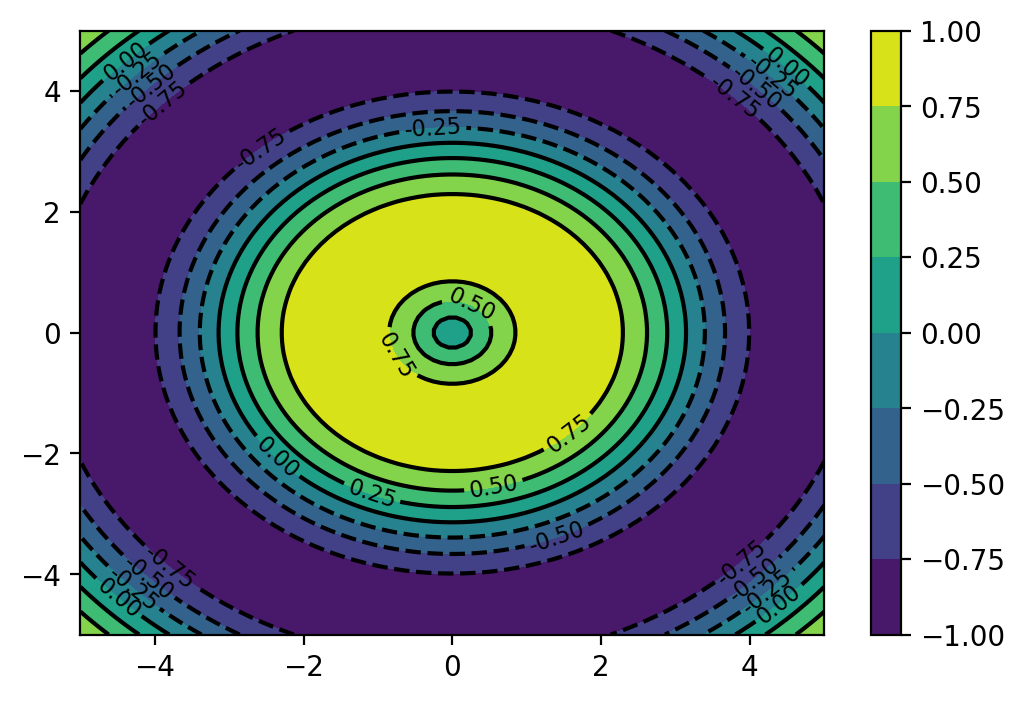
代码如下:
import numpy as np
import matplotlib.pyplot as plt

# 生成一些示例数据
x = np.linspace(-5, 5, 100)
y = np.linspace(-5, 5, 100)
X, Y = np.meshgrid(x, y)
Z = np.sin(np.sqrt(X**2 + Y**2))

# 创建一个带有白色背景的等值线图
fig, ax = plt.subplots(dpi=200)

contour = ax.contourf(X, Y, Z, cmap='viridis')

cbar = plt.colorbar(contour)

fmt = '%.2f'
clabels = plt.contour(X, Y, Z, colors='black', levels=contour.levels)
plt.clabel(clabels, inline=True, fontsize=8,
           fmt=fmt,
           colors='black',
           use_clabeltext=True,
           manual=False)
设置等值线文本信息,实际上就是for 循环加if 判断。这里加上if判断是为了只显示想要的数值对应的背景色
[txt.set_bbox({'boxstyle': 'round',
            'facecolor': 'w',
            'edgecolor': 'black',
            'pad': 0.04}) if txt.get_text() in ('0.5','0.25', '-0.5','-0.25') else txt.set_visible(False) for txt in  clabels.labelTexts]
其中,boxstyle设置文本box的风格,矩形还是圆形等;
facecolor和edgecolor不说了,pad可以理解为设置矩形框的宽窄程度,可以自己调整数值测试一下效果。
最终得到的结果如下:
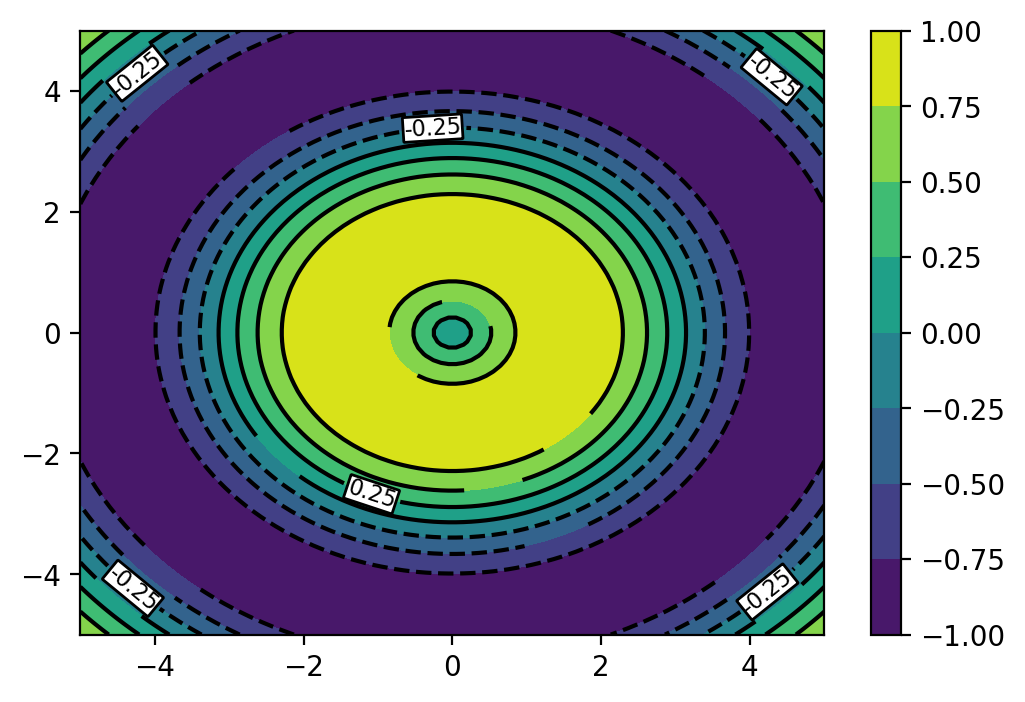
基本上是实现想要的目的,以下是全部代码:
"""
Created on Fri Oct  6 16:46:32 2023

@author: jianpu

@blog :  https://blog.csdn.net/weixin_44237337?spm=1000.2115.3001.5343

@email:  xianpu.ji@hhu.edu.cn

introduction : keep learning althongh walk slowly
"""

import numpy as np
import matplotlib.pyplot as plt

# 生成一些示例数据
x = np.linspace(-5, 5, 100)
y = np.linspace(-5, 5, 100)
X, Y = np.meshgrid(x, y)
Z = np.sin(np.sqrt(X**2 + Y**2))

# 创建一个带有白色背景的等值线图
fig, ax = plt.subplots(dpi=200)

contour = ax.contourf(X, Y, Z, cmap='viridis')

cbar = plt.colorbar(contour)

fmt = '%.2f'
clabels = plt.contour(X, Y, Z, colors='black', levels=contour.levels)
plt.clabel(clabels, inline=True, fontsize=8,
           fmt=fmt,
           colors='black',
           use_clabeltext=True,
           manual=False)

[txt.set_bbox({'boxstyle': 'round',
            'facecolor': 'w',
            'edgecolor': 'black',
            'pad': 0.04}) if txt.get_text() in ('0.5','0.25', '-0.5','-0.25') else txt.set_visible(False) for txt in  clabels.labelTexts]


plt.show()
https://www.ncl.ucar.edu/Applications/contourLab.shtml
本文来自互联网用户投稿,该文观点仅代表作者本人,不代表本站立场。本站仅提供信息存储空间服务,不拥有所有权,不承担相关法律责任。 如若内容造成侵权/违法违规/事实不符,请联系我的编程经验分享网邮箱:chenni525@qq.com进行投诉反馈,一经查实,立即删除!
- Python教程
- 深入理解 MySQL 中的 HAVING 关键字和聚合函数
- Qt之QChar编码(1)
- MyBatis入门基础篇
- 用Python脚本实现FFmpeg批量转换
- R&S?SMM100A 矢量信号发生器具备毫米波测试功能的中档矢量信号发生器
- 数据结构之树和森林
- 如何使用JavaScript检测文件类型?
- 【VTK】一文理解VTK中的轮廓(Contour)
- c++算法之前缀和
- Python redis安装&使用教程
- 数据结构与算法-二叉树-从中序与后序遍历序列构造二叉树
- Kotlin协程的JVM实现源码分析(上)
- 如何使用vite框架封装一个js库,并发布npm包
- 圈小猫游戏HTML源码