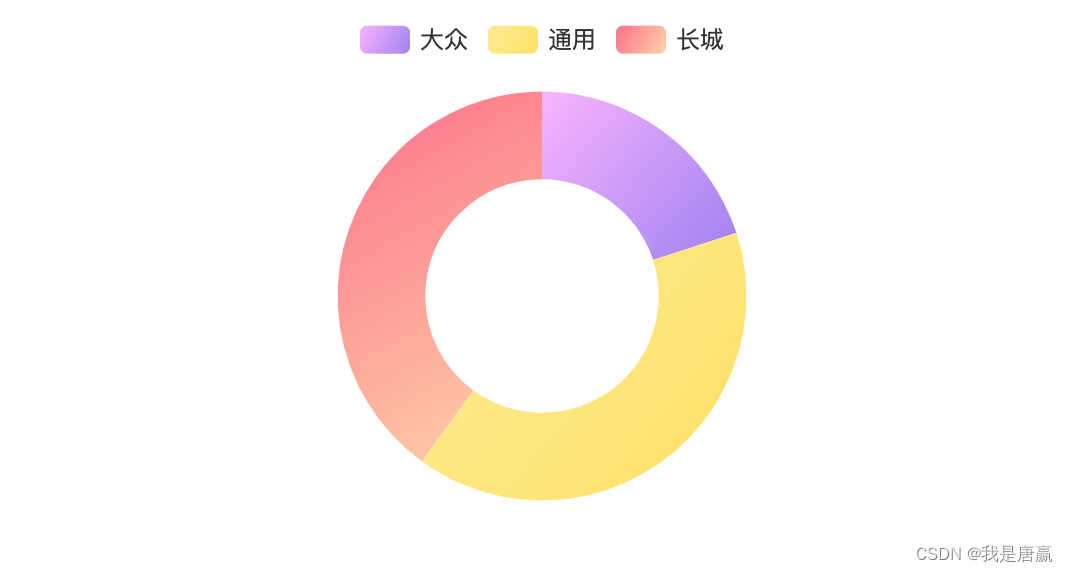
echarts 实现饼图pie渐变色显示
发布时间:2023年12月20日
?实现效果

代码
option = {
        tooltip: {
            trigger: 'item'
        },
        legend: {
            top: '2%',
            left: 'center',
        },
        series: [
            {
                name: '产品结构',
                type: 'pie',
                radius: ['40%', '70%'],
                avoidLabelOverlap: false,
                label: {
                    show: false,
                    position: 'center'
                },
                emphasis: {
                    label: {
                        show: true,
                        fontSize: '40',
                        fontWeight: 'bold'
                    }
                },
                labelLine: {
                    show: false
                },
                data: [{"name":"大众", value:10},
                       {"name":"通用", value:20},
                       {"name":"长城", value:20}
                       ],
                itemStyle: {
                    normal: {
                        color: function (params) {
                            var colorList = [
                                ['#fab2ff','#9f7ef4'],
                                ['#ffeb90','#ffe25c'],
                                ['#fe6f88','#ffd3a5'],
                            ];
                            var index = params.dataIndex;
                            return new echarts.graphic.LinearGradient(0, 0, 1, 1,
                                [{
                                    offset: 0,
                                    color: colorList[index][0]
                                },
                                    {
                                        offset: 1,
                                        color: colorList[index][1]
                                    }
                                ]);
                        }
                    }
                }
            }
        ]
    };
查看效果地址:
将内容复制到在左边的参数栏
文章来源:https://blog.csdn.net/gdgztt/article/details/135088330
本文来自互联网用户投稿,该文观点仅代表作者本人,不代表本站立场。本站仅提供信息存储空间服务,不拥有所有权,不承担相关法律责任。 如若内容造成侵权/违法违规/事实不符,请联系我的编程经验分享网邮箱:chenni525@qq.com进行投诉反馈,一经查实,立即删除!
本文来自互联网用户投稿,该文观点仅代表作者本人,不代表本站立场。本站仅提供信息存储空间服务,不拥有所有权,不承担相关法律责任。 如若内容造成侵权/违法违规/事实不符,请联系我的编程经验分享网邮箱:chenni525@qq.com进行投诉反馈,一经查实,立即删除!
最新文章
- Python教程
- 深入理解 MySQL 中的 HAVING 关键字和聚合函数
- Qt之QChar编码(1)
- MyBatis入门基础篇
- 用Python脚本实现FFmpeg批量转换
- 深入解析JavaScript中的函数绑定和命名函数表达式
- HACK ME PLEASE(详细版)
- 苹果手机数据删除怎么恢复?这几个方法值得一试!
- Docker(二)安装指南
- FPGA经典书籍分享
- 喜讯省钱-微软Copilot现采用原本需付费的GPT-4 Turbo,每月为您省下20美元
- 最新UnityDOTS Physics物理引擎碰撞查询核心分析
- 解决 ssh: connect to host github.com port 22: Connection timed out
- hutool图片二维码生成
- 2024-01-17(SpringCloud)