leaflet 使用antpath加载河流流动效果
发布时间:2024年01月18日
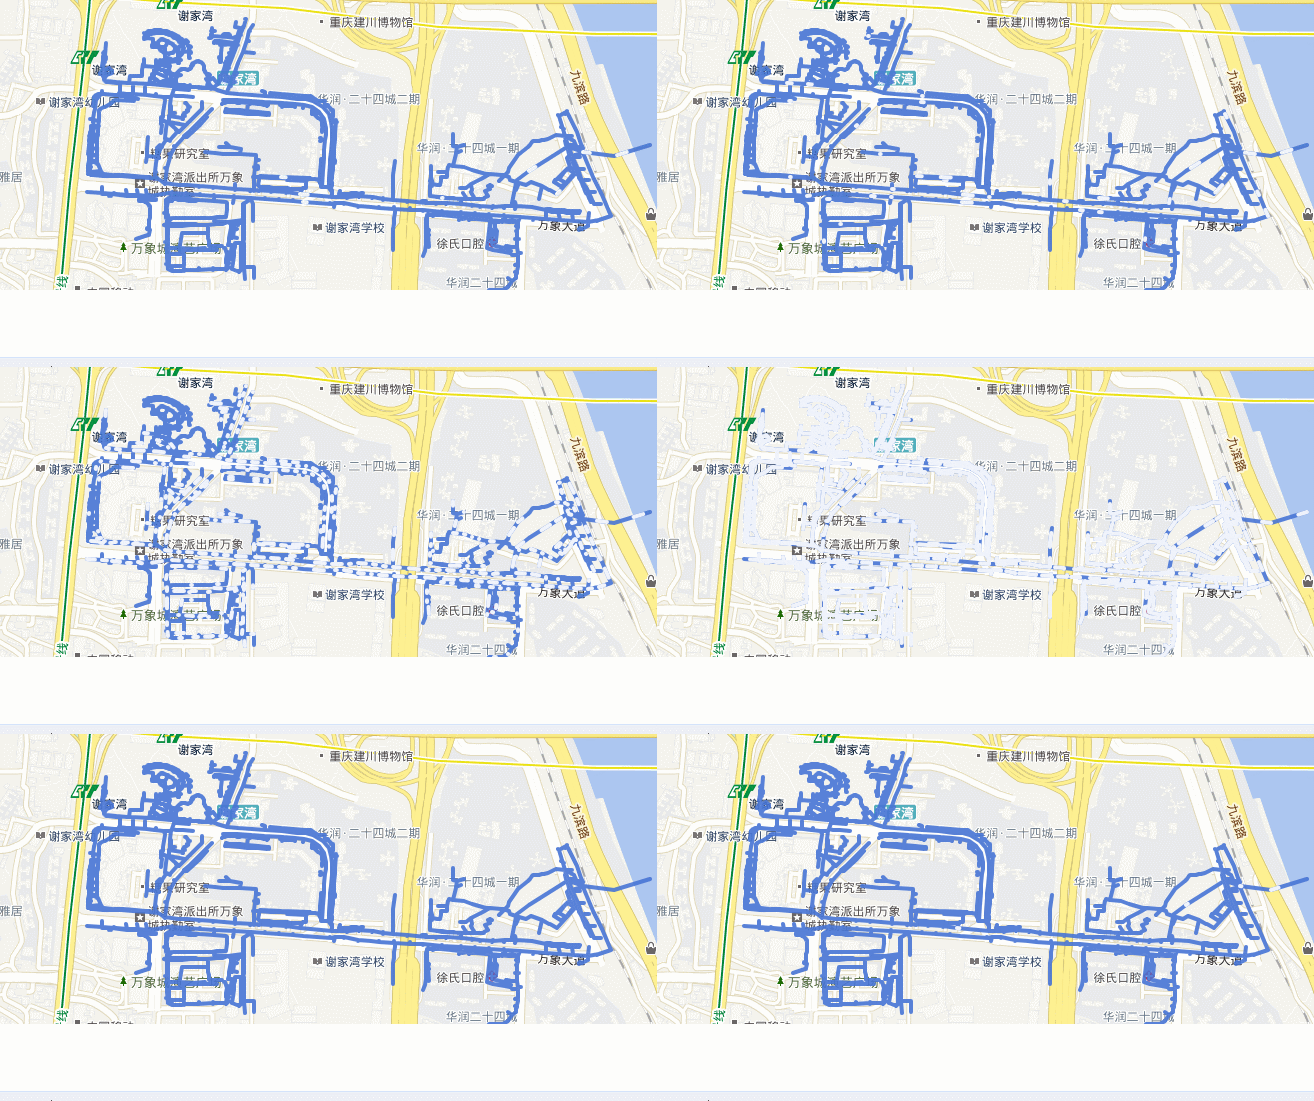
?1.效果图:

2.代码
<!DOCTYPE html>
<html lang="en">

<head>
  <meta charset="UTF-8">
  <meta http-equiv="X-UA-Compatible" content="IE=edge">
  <meta name="viewport" content="width=device-width, initial-scale=1.0">
  <title>Document</title>


  <link rel="stylesheet" href="https://unpkg.com/leaflet@1.6.0/dist/leaflet.css" />
  <script src="https://unpkg.com/leaflet@1.6.0/dist/leaflet.js"></script>
  <script src="https://cdn.bootcdn.net/ajax/libs/jquery/3.7.1/jquery.js"></script>
  <script src="https://unpkg.com/leaflet-ant-path" type="text/javascript"></script>
</head>

<body>
  <div id='map' style="width:100%;min-height:300px;height:100%"></div>
  <div>
    <button onclick="tag1()">流动效果</button>
    <button onclick="tag2()">管线</button>
  </div>
  <script>
    let map = L.map('map', {
      center: [29.516916275024414, 106.52285814285278],
      maxZoom: 24,
      zoom: 16,   //缩放比列
      crs: L.CRS.EPSG4326,
      zoomControl: false, //禁用 + - 按钮
      doubleClickZoom: false,  // 禁用双击放大
      attribution: '',
      attributionControl: false  // 移除右下角leaflet标识sxx
    })
    map.on('click', (e) => {
      console.log(e)
    });
    function addSST() {	//加载天地图
      let tiandituLayer = L.tileLayer(
        "http://t0.tianditu.gov.cn/vec_c/wmts?layer=vec&style=default&tilematrixset=c&Service=WMTS&Request=GetTile&Version=1.0.0&Format=tiles&TileMatrix={z}&TileCol={x}&TileRow={y}&tk=ac2691809b5dd7ee20869f7a6ba2abc4", {
        maxZoom: 20,
        tileSize: 256,
        zoomOffset: 1,
        minZoom: 3
      })
      let tiandituMark = L.tileLayer(
        "http://t1.tianditu.com/cva_c/wmts?layer=cva&style=default&tilematrixset=c&Service=WMTS&Request=GetTile&Version=1.0.0&Format=tiles&TileMatrix={z}&TileCol={x}&TileRow={y}&tk=ac2691809b5dd7ee20869f7a6ba2abc4", {
        maxZoom: 20,
        tileSize: 256,
        zoomOffset: 1,
        zIndex: 5,
        minZoom: 3
      })
      map.addLayer(tiandituLayer);
      map.addLayer(tiandituMark);

    }
    //let key = row.pkCode ? `pkbm ='${row.pkCode}'` : `pkmc='${row.name}'`;
    key = `pkbm ='FA-500107-0002-YH-00'`;
    let url1 = `http://120.78.84.109:8089/geoserver/JLPGIS/ows?service=WFS&version=1.0.0&request=GetFeature&typeName=JLPGIS%3Aykyt-psfx&maxFeatures=999999
      &outputFormat=application%2Fjson&CQL_FILTER=${key}`;
    let LJoOtletTraceLayer = null;
    let data = [];
    const antPathFn = data => {
      let antPath = L.polyline.antPath;
      return antPath(data, {
        paused: false, //暂停  初始化状态
        reverse: true, //方向反转
        delay: 6000, //延迟,数值越大效果越缓慢
        dashArray: [10, 50], //间隔样式
        weight: 4, //线宽
        opacity: 0.9, //透明度
        color: "#4875D5",
        pulseColor: "#fff"
      }).addTo(map);
    };
    addSST()
    tag1()
    let data1 = []
    function tag1() {
    //通过变量来判断及删除
      if (map.hasLayer(LJoOtletTraceLayer)) {
        console.log('地图中存在标记图层');
        map.removeLayer(LJoOtletTraceLayer  )
      } else {
        console.log('地图中不存在标记图层');
      }
      $.ajax({
        url: url1, // 设置请求的URL地址
        method: "GET", // 设置请求的方法(GET、POST等)
        dataType: "json", // 设置返回结果的类型为JSON格式
        data: {},
        success: function (response) {
          // 当请求成功时触发的回调函数
          console.log(response); // 输出服务器返回的数据

          L.geoJSON(response.features, {
            onEachFeature: (feature, layer) => {
              feature.geometry.coordinates[0].forEach(function (e, i) {
                data.push([e[1], e[0]]);
              });
              data1.push(feature.geometry.coordinates.map(item => {
                // console.log(item)
                return reverse2DArray(item)
                // item.reverse()
              }))
            }
          });
          console.log("data--=-", data);
          console.log("data1--=-", data1);
          LJoOtletTraceLayer = antPathFn(data1);
          /* let pwk = L.geoJSON(response.features, {
            pointToLayer: function (geoJsonPoint, latlng) {
              return L.circleMarker(latlng);
            },
            style: function (feature) {
              return { color: "blue" };
            }
          }).addTo(map); */
        },
        error: function () {
          // 当请求失败时触发的回调函数
          console.error("请求失败!");
        }
      });
    }
    function reverse2DArray(arr) {
      // 遍历二维数组,将每个一维数组进行翻转
      for (let i = 0; i < arr.length; i++) {
        arr[i].reverse();
      }
      // 将翻转后的二维数组进行逆序排列
      arr.reverse();
      return arr;
    }
    function tag2() {
      var jlpmask = L.tileLayer
        .wms('http://120.78.84.109:8089' + "/geoserver/JLPGIS/wms", {
          id: "ykyt",
          layers: "JLPGIS:ykyt-psfx", //需要加载的图层
          format: "image/png", //返回的数据格式
          transparent: true,
          maxZoom: 24,
          crs: L.CRS.EPSG4326,
          CQL_FILTER: key,
        })
        .addTo(map);
    }
    function tag3() {
      // map.hasLayer("ykyt") && map.removeLayer("ykyt")
      $.ajax({
        url: url1, // 设置请求的URL地址
        method: "GET", // 设置请求的方法(GET、POST等)
        dataType: "json", // 设置返回结果的类型为JSON格式
        data: {},
        success: function (response) {
          // 当请求成功时触发的回调函数
          console.log(response); // 输出服务器返回的数据

          // LJoOtletTraceLayer = antPathFn(data);
          let pwk = L.geoJSON(response.features, {
            style: function (feature) {
              return { color: "blue" };
            }
          }).addTo(map);
        },
        error: function () {
          // 当请求失败时触发的回调函数
          console.error("请求失败!");
        }
      });
    }

  </script>
</body>

</html>
文章来源:https://blog.csdn.net/qq_37550440/article/details/135675029
本文来自互联网用户投稿,该文观点仅代表作者本人,不代表本站立场。本站仅提供信息存储空间服务,不拥有所有权,不承担相关法律责任。 如若内容造成侵权/违法违规/事实不符,请联系我的编程经验分享网邮箱:chenni525@qq.com进行投诉反馈,一经查实,立即删除!
本文来自互联网用户投稿,该文观点仅代表作者本人,不代表本站立场。本站仅提供信息存储空间服务,不拥有所有权,不承担相关法律责任。 如若内容造成侵权/违法违规/事实不符,请联系我的编程经验分享网邮箱:chenni525@qq.com进行投诉反馈,一经查实,立即删除!
最新文章
- Python教程
- 深入理解 MySQL 中的 HAVING 关键字和聚合函数
- Qt之QChar编码(1)
- MyBatis入门基础篇
- 用Python脚本实现FFmpeg批量转换
- 常见的几种迁移学习的方式的介绍 & Batch Normalization的原理介绍
- kubernetes 集群 oom 导致集群无法访问
- 迅为RK3588开发板瑞芯微国产化工业ARM核心板AI人工智能
- Prometheus实战篇:Prometheus监控redis
- 新三板炒股开户需要满足哪些条件?交易规则有哪些?
- 【Linux】Linux基础之权限
- 左手持续亏损,右手加速并购,大北农欲凭规模“屯粮过冬”
- 2023年全球18例经典创意二维码营销案例,建议收藏!
- vivado 关于时钟
- 国密算法学习