Python绘折现图之不同参数与布局展示
发布时间:2024年01月16日
一般使用的绘制折线图的代码使用px.line就足够
import plotly.express as px
line_fig = px.line(df, x="period", y="value", color="variable", title="title", markers=True)
或者就是使用go.scatter
import plotly.graph_objects as go
line_fig = go.Figure(data=go.Scatter(x=x_list, y=y_list, mode="lines", name="line1"))具体可以参考plotly_line-charts
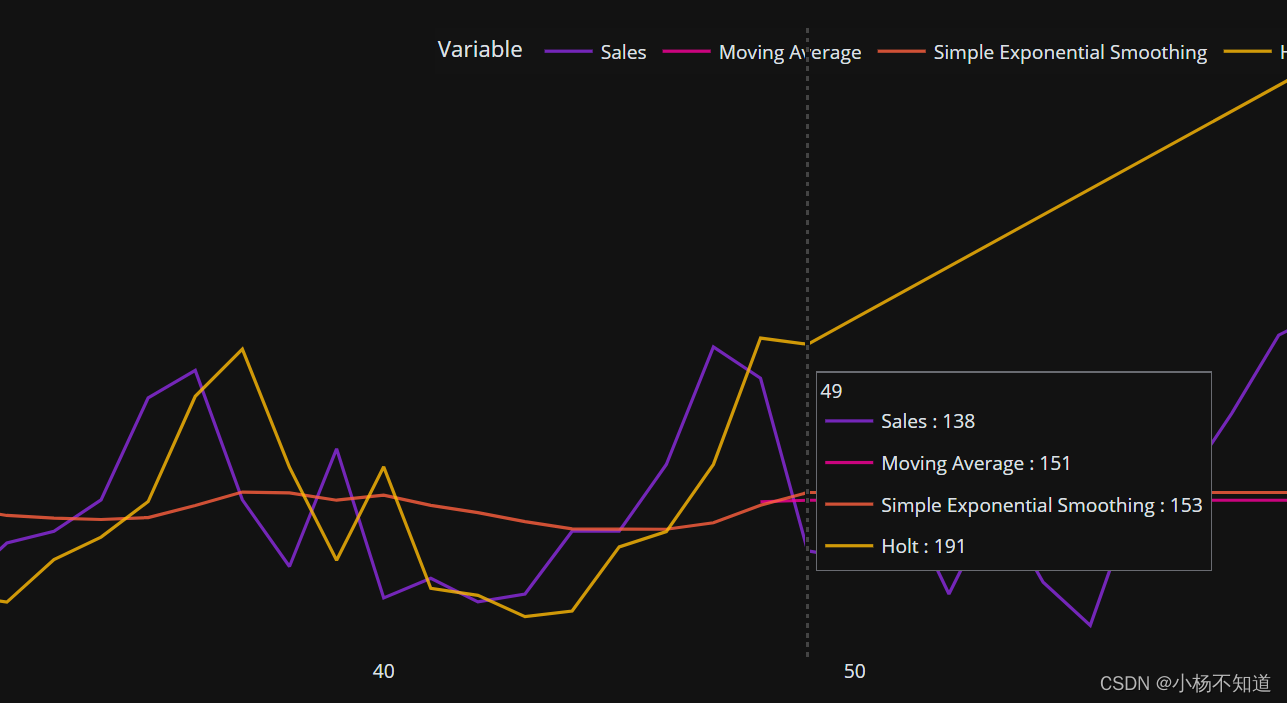
那么如果我同时有几条折线在同一张图中,但我的hovertemplate希望显示同一个时期(x轴)的不同值(y轴),应该如何实现呢
line_fig = px.line(df,x='Period',y=['History','Moving Average','Simple Exponential Smoothing','Holt'],labels=dict(value="Value"))
line_fig.update_traces(hovertemplate='%{y:,.0f}')
line_fig.update_layout(hovermode="x unified",legend_title_text='Variable')
于是可以得到下图
更多的可以移步plotly_hovertext&formatting
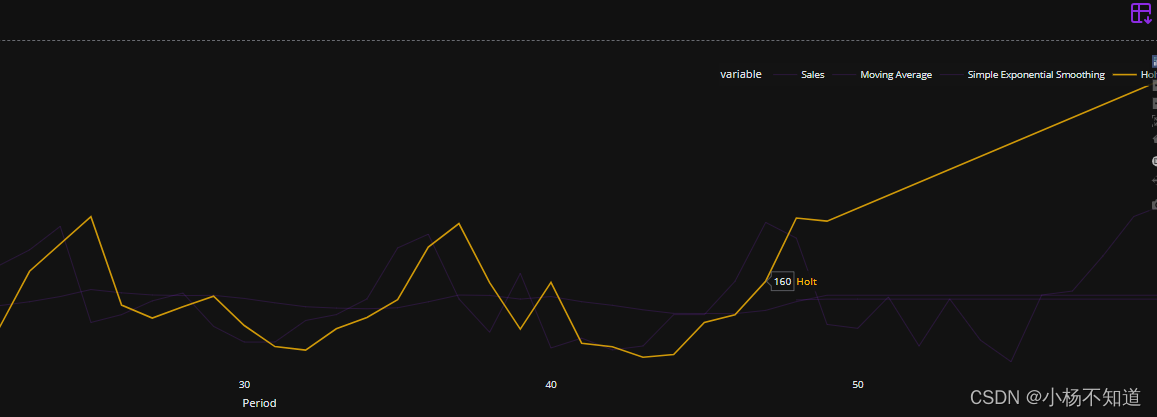
接下来就是如何使得绘制的graph在鼠标悬浮在某一条线上时候仅显示悬浮于其上的折现段而隐藏其余线段
line_fig = px.line(df,x='Period',y=['History','Moving Average','Simple Exponential Smoothing','Holt'],labels=dict(value="Value"))
line_fig.update_traces(hovertemplate='%{y:,.0f}')

dcc.Graph(id='detail-fig',figure=line_fig, clear_on_unhover=True)

@app.callback(
    Output('detail-fig', 'figure'),
    Input('detail-fig', 'hoverData'),
    prevent_initial_call=True
)
def display_hover_data(hoverData):

    fig = go.Figure(line_fig)

    if hoverData != None:
        fig.for_each_trace(lambda t: t.update(line_color = 'rgba(140, 43, 226, 0.3)',line_width = 1) if t.name != fig.data[hoverData['points'][0]['curveNumber']].name else dash.no_update)
        return fig
    else:
        return fig
这样就得到了下图

以上就是关于python绘制折线图的一些分享
文章来源:https://blog.csdn.net/m0_68459683/article/details/135595666
本文来自互联网用户投稿,该文观点仅代表作者本人,不代表本站立场。本站仅提供信息存储空间服务,不拥有所有权,不承担相关法律责任。 如若内容造成侵权/违法违规/事实不符,请联系我的编程经验分享网邮箱:chenni525@qq.com进行投诉反馈,一经查实,立即删除!
本文来自互联网用户投稿,该文观点仅代表作者本人,不代表本站立场。本站仅提供信息存储空间服务,不拥有所有权,不承担相关法律责任。 如若内容造成侵权/违法违规/事实不符,请联系我的编程经验分享网邮箱:chenni525@qq.com进行投诉反馈,一经查实,立即删除!
最新文章
- Python教程
- 深入理解 MySQL 中的 HAVING 关键字和聚合函数
- Qt之QChar编码(1)
- MyBatis入门基础篇
- 用Python脚本实现FFmpeg批量转换
- 【网络安全】学习Web安全必须知道的一本书
- docker-harbor私有仓库
- 软件测试主管工作日常随记-总
- Android解决报错 superclass access check failed: class
- 在未来的一个时期,阿里将会和AI电商联系在一起
- Kafka Stream 流式计算
- [Python进阶] 操作Ftp:ftplib
- 【cesium-5】鼠标交互与数据查询
- 智能变电站协议系列-1、GOOSE、SV、MMS协议简介及GOOSE示例运行问题(IEC61850)
- 计算机报错mfc100.dll丢失的修复教程,一招搞定电脑找不到dll问题