一遍文章教你快速入门vue3+ts+Echarts
发布时间:2024年01月22日
之前做得项目有vue2和vue3,使用echarts的方式大同小异,这篇文章就先介绍vue3的用法
下载echart
可以看官方文档,其实说得很清楚echart官方
npm install echarts --save
按需引入echart
由于我得项目中使用到得echart不多,所以这里我引入几个组件即可,缩小项目体积
创建util/echart.ts
// 引入 echarts 核心模块,核心模块提供了 echarts 使用必须要的接口。
import * as echarts from "echarts/core";

/** 引入柱状图 + 折线图 + 饼图,图表后缀都为 Chart,一般常用的就这三个,如果还需要其他的,就自行添加  */
import { BarChart, LineChart, PieChart } from "echarts/charts";

// 引入提示框,标题,直角坐标系,数据集,内置数据转换器组件,组件后缀都为 Component
import {
  TitleComponent,
  TooltipComponent,
  GridComponent,
  LegendComponent,
} from "echarts/components";

// 标签自动布局
import { LabelLayout, UniversalTransition } from "echarts/features";

// 引入 Canvas 渲染器
import { CanvasRenderer } from "echarts/renderers";

// 注册
echarts.use([
  TitleComponent,
  TooltipComponent,
  GridComponent,
  LegendComponent,
  LabelLayout,
  UniversalTransition,
  CanvasRenderer,
  BarChart,
  LineChart,
  PieChart,
]);
export default echarts;
引入main.ts
// 引入echarts
import echarts from "./utils/echarts";
//全局注册
app.config.globalProperties.$echarts = echarts
使用
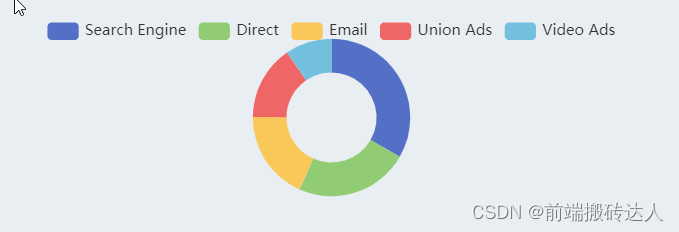
这里我举例环形
<div class="fl" style="width: calc(100% - 130px)">
    <div class="canvas source-canvas" ref="source" style="width: 100%"></div>
  </div>

let source = ref(null);
let sourceOption = reactive({
  tooltip: {
    trigger: 'item',
    formatter: '{a} <br/>{b}: {c} ({d}%)',
  },
  legend: {
    top: '5%',
    left: 'center',
  },
  series: [
    {
      name: 'Access From',
      type: 'pie',
      radius: ['40%', '70%'],
      avoidLabelOverlap: false,
      label: {
        show: false,
        position: 'center',
      },
      emphasis: {
        label: {
          show: true,
          fontSize: 40,
          fontWeight: 'bold',
        },
      },
      labelLine: {
        show: false,
      },
      data: [
        { value: 1048, name: 'Search Engine' },
        { value: 735, name: 'Direct' },
        { value: 580, name: 'Email' },
        { value: 484, name: 'Union Ads' },
        { value: 300, name: 'Video Ads' },
      ],
    },
  ],
});
//引入全局注册的proxy
const { proxy } = getCurrentInstance() as ComponentInternalInstance;
let myChart = proxy.$echarts.init(source.value);
myChart.setOption(sourceOption);

##这样子环形就出来啦,配置那些可以参考官方配置参数
文章来源:https://blog.csdn.net/wyq12138/article/details/135749278
本文来自互联网用户投稿,该文观点仅代表作者本人,不代表本站立场。本站仅提供信息存储空间服务,不拥有所有权,不承担相关法律责任。 如若内容造成侵权/违法违规/事实不符,请联系我的编程经验分享网邮箱:chenni525@qq.com进行投诉反馈,一经查实,立即删除!
本文来自互联网用户投稿,该文观点仅代表作者本人,不代表本站立场。本站仅提供信息存储空间服务,不拥有所有权,不承担相关法律责任。 如若内容造成侵权/违法违规/事实不符,请联系我的编程经验分享网邮箱:chenni525@qq.com进行投诉反馈,一经查实,立即删除!
最新文章
- Python教程
- 深入理解 MySQL 中的 HAVING 关键字和聚合函数
- Qt之QChar编码(1)
- MyBatis入门基础篇
- 用Python脚本实现FFmpeg批量转换
- Educational Codeforces Round 154 (Rated for Div. 2)补题
- 怎么设计一个简单又直观的接口?
- 【难点】【LRU】146.LRU缓存
- MySQL索引失效场景及原理
- Spring学习之——基于注解的IOC配置
- TS学习笔记八:命名空间
- 实战 | 数据战略指导下的数据资产运营思考
- HCIE云计算备考知识点记录
- python基础——进程
- 【Qt】最详细教程,如何从零配置Qt Android安卓环境