Mars3d的BusineDataLayer应该传data格式实现聚合效果
问题:
1.通过【Mars3d】加载new mars3d.layer.BusineDataLayer(的如果不用url使用data的话,格式应该是什么样子的呢?
相关说明:实质就是就是GraphicLayer,自己加graphic进去。
使用data的话要否需要用onCreateGraphic代替symbol吗实现添加矢量的效果?
回复:
相关data的格式使用.相关代码:
import * as mars3d from "mars3d"
export let map // mars3d.Map三维地图对象
export let graphicLayer // 矢量图层对象
// 需要覆盖config.json中地图属性参数(当前示例框架中自动处理合并)
export const mapOptions = {
? scene: {
? ? center: {"lat":32.632367,"lng":118.899899,"alt":4713595.4,"heading":348,"pitch":-69}
? }
}
/**
?* 初始化地图业务,生命周期钩子函数(必须)
?* 框架在地图初始化完成后自动调用该函数
?* @param {mars3d.Map} mapInstance 地图对象
?* @returns {void} 无
?*/
export function onMounted(mapInstance) {
? map = mapInstance // 记录map
?
? addBusinessLayer()
}
?
let historyFiresRes = {
? "msg": "success",
? "code": 0,
? "data": [
? ? {
? ? ? "acq_time": "0454",
? ? ? "frp": 1.7,
? ? ? "year": "2019",
? ? ? "acq_date": "2019-12-04",
? ? ? "latitude": 40.81285,
? ? ? "confidence": "n",
? ? ? "scan": 0.39,
? ? ? "instrument": "VIIRS",
? ? ? "geom": "POINT(118.5964 40.81285)",
? ? ? "version": "2.0NRT",
? ? ? "brightness": 327.7,
? ? ? "bright_t31": 280.7,
? ? ? "daynight": "D",
? ? ? "id": 1,
? ? ? "satellite": "1",
? ? ? "track": 0.36,
? ? ? "longitude": 118.5964
? ? },
? ? {
? ? ? "acq_time": "0500",
? ? ? "frp": 3.2,
? ? ? "year": "2019",
? ? ? "acq_date": "2019-12-09",
? ? ? "latitude": 41.2258,
? ? ? "confidence": "n",
? ? ? "scan": 0.39,
? ? ? "instrument": "VIIRS",
? ? ? "geom": "POINT(118.77624 41.2258)",
? ? ? "version": "2.0NRT",
? ? ? "brightness": 344.2,
? ? ? "bright_t31": 281.6,
? ? ? "daynight": "D",
? ? ? "id": 2,
? ? ? "satellite": "1",
? ? ? "track": 0.36,
? ? ? "longitude": 118.77624
? ? },
? ? {
? ? ? "acq_time": "1800",
? ? ? "frp": 0.4,
? ? ? "year": "2019",
? ? ? "acq_date": "2019-12-12",
? ? ? "latitude": 40.52177,
? ? ? "confidence": "n",
? ? ? "scan": 0.38,
? ? ? "instrument": "VIIRS",
? ? ? "geom": "POINT(117.60754 40.52177)",
? ? ? "version": "2.0NRT",
? ? ? "brightness": 296.8,
? ? ? "bright_t31": 267.7,
? ? ? "daynight": "N",
? ? ? "id": 3,
? ? ? "satellite": "1",
? ? ? "track": 0.36,
? ? ? "longitude": 117.60754
? ? },
? ? {
? ? ? "acq_time": "1724",
? ? ? "frp": 1,
? ? ? "year": "2019",
? ? ? "acq_date": "2019-12-14",
? ? ? "latitude": 40.73357,
? ? ? "confidence": "n",
? ? ? "scan": 0.52,
? ? ? "instrument": "VIIRS",
? ? ? "geom": "POINT(118.43446 40.73357)",
? ? ? "version": "2.0NRT",
? ? ? "brightness": 301.9,
? ? ? "bright_t31": 261.3,
? ? ? "daynight": "N",
? ? ? "id": 4,
? ? ? "satellite": "1",
? ? ? "track": 0.5,
? ? ? "longitude": 118.43446
? ? },
? ? {
? ? ? "acq_time": "1824",
? ? ? "frp": 0.7,
? ? ? "year": "2019",
? ? ? "acq_date": "2019-12-16",
? ? ? "latitude": 40.59779,
? ? ? "confidence": "n",
? ? ? "scan": 0.41,
? ? ? "instrument": "VIIRS",
? ? ? "geom": "POINT(118.62975 40.59779)",
? ? ? "version": "2.0NRT",
? ? ? "brightness": 297.9,
? ? ? "bright_t31": 271.7,
? ? ? "daynight": "N",
? ? ? "id": 5,
? ? ? "satellite": "1",
? ? ? "track": 0.45,
? ? ? "longitude": 118.62975
? ? },
? ? {
? ? ? "acq_time": "1824",
? ? ? "frp": 1.4,
? ? ? "year": "2019",
? ? ? "acq_date": "2019-12-16",
? ? ? "latitude": 40.52311,
? ? ? "confidence": "n",
? ? ? "scan": 0.55,
? ? ? "instrument": "VIIRS",
? ? ? "geom": "POINT(117.60539 40.52311)",
? ? ? "version": "2.0NRT",
? ? ? "brightness": 296.3,
? ? ? "bright_t31": 269.8,
? ? ? "daynight": "N",
? ? ? "id": 6,
? ? ? "satellite": "1",
? ? ? "track": 0.43,
? ? ? "longitude": 117.60539
? ? }
? ]
}
function addBusinessLayer() {
? // 创建矢量数据图层(业务数据图层)
? graphicLayer = new mars3d.layer.BusineDataLayer({
? ? data: historyFiresRes,
? ? dataColumn: "data", // 数据接口中对应列表所在的取值字段名
? ? lngColumn: "longitude",
? ? latColumn: "latitude",
? ? // 点的聚合配置
? ? clustering: {
? ? ? enabled: true,
? ? ? pixelRange: 10,
? ? ? clampToGround: false,
? ? // ? addHeight: 1000
? ? ? // opacity: 1
? ? ? // getImage: function (count) { // getImage是完全自定义方式
? ? ? // ? let colorIn
? ? ? // ? if (count < 10) {
? ? ? // ? ? colorIn = "rgba(110, 204, 57, 0.6)"
? ? ? // ? } else if (count < 100) {
? ? ? // ? ? colorIn = "rgba(240, 194, 12, ?0.6)"
? ? ? // ? } else {
? ? ? // ? ? colorIn = "rgba(241, 128, 23, ?0.6)"
? ? ? // ? }
? ? ? // ? const radius = 40
? ? ? // ? const thisSize = radius * 2
? ? ? // ? const circleCanvas = document.createElement("canvas")
? ? ? // ? circleCanvas.width = thisSize
? ? ? // ? circleCanvas.height = thisSize
? ? ? // ? const circleCtx = circleCanvas.getContext("2d", { willReadFrequently: true })
? ? ? // ? circleCtx.fillStyle = "#ffffff00"
? ? ? // ? circleCtx.globalAlpha = 0.0
? ? ? // ? circleCtx.fillRect(0, 0, thisSize, thisSize)
? ? ? // ? // 圆形底色
? ? ? // ? circleCtx.globalAlpha = 1.0
? ? ? // ? circleCtx.beginPath()
? ? ? // ? circleCtx.arc(radius, radius, radius, 0, Math.PI * 2, true)
? ? ? // ? circleCtx.closePath()
? ? ? // ? circleCtx.fillStyle = colorIn
? ? ? // ? circleCtx.fill()
? ? ? // ? // 数字文字
? ? ? // ? const text = "故障" + count
? ? ? // ? circleCtx.font = radius * 0.6 + "px bold normal" // 设置字体
? ? ? // ? circleCtx.fillStyle = "#ffffff" // 设置颜色
? ? ? // ? circleCtx.textAlign = "center" // 设置水平对齐方式
? ? ? // ? circleCtx.textBaseline = "middle" // 设置垂直对齐方式
? ? ? // ? circleCtx.fillText(text, radius, radius) // 绘制文字(参数:要写的字,x坐标,y坐标)
? ? ? // ? return circleCanvas.toDataURL("image/png") // getImage方法返回任意canvas的图片即可
? ? ? // }
? ? },
? ? symbol: {
? ? ? type: "billboardP",
? ? ? styleOptions: {
? ? ? ? image: "img/marker/mark-blue.png",
? ? ? ? width: 25,
? ? ? ? height: 34, // billboard聚合必须有width、height
? ? ? ? horizontalOrigin: Cesium.HorizontalOrigin.CENTER,
? ? ? ? verticalOrigin: Cesium.VerticalOrigin.BOTTOM,
? ? ? ? scaleByDistance: new Cesium.NearFarScalar(1000, 0.7, 5000000, 0.3),
? ? ? ? label: {
? ? ? ? ? text: "{text}",
? ? ? ? ? font_size: 19,
? ? ? ? ? color: Cesium.Color.AZURE,
? ? ? ? ? outline: true,
? ? ? ? ? outlineColor: Cesium.Color.BLACK,
? ? ? ? ? outlineWidth: 2,
? ? ? ? ? horizontalOrigin: Cesium.HorizontalOrigin.LEFT,
? ? ? ? ? verticalOrigin: Cesium.VerticalOrigin.BOTTOM,
? ? ? ? ? pixelOffset: new Cesium.Cartesian2(10, 0), // 偏移量
? ? ? ? ? distanceDisplayCondition: new Cesium.DistanceDisplayCondition(0.0, 80000)
? ? ? ? }
? ? ? }
? ? }
? ? // 自定义创建对象,可替代symbol、
? ? // onCreateGraphic: function (e) {
? ? // ? const graphic = new mars3d.graphic.BillboardEntity({
? ? // ? ? position: e.position,
? ? // ? ? style: {
? ? // ? ? ? image: "img/marker/lace-blue.png",
? ? // ? ? ? width: 25,
? ? // ? ? ? height: 34, // 聚合必须有width、height
? ? // ? ? ? horizontalOrigin: Cesium.HorizontalOrigin.CENTER,
? ? // ? ? ? verticalOrigin: Cesium.VerticalOrigin.BOTTOM
? ? // ? ? },
? ? // ? ? attr: e.attr
? ? // ? })
? ? // ? graphicLayer.addGraphic(graphic)
? ? // },
? })
? map.addLayer(graphicLayer)
? graphicLayer.on("clustering", function (event) {
? ? console.log("新增聚合对象", event)
? })
? // 单击事件
? graphicLayer.on(mars3d.EventType.click, function (event) {
? ? console.log("你单击了", event)
? ? if (map.camera.positionCartographic.height > 90000) {
? ? ? const graphic = event.graphic
? ? ? // graphic.closePopup()
? ? ? if (graphic?.cluster) {
? ? ? ? // 单击了聚合的点
? ? ? ? console.log("单击了聚合的点", graphic.getGraphics())
? ? ? } else {
? ? ? ? // 单击了具体的点对象
? ? ? ? const position = graphic.positionShow
? ? ? ? map.flyToPoint(position, {
? ? ? ? ? radius: 5000, // 距离目标点的距离
? ? ? ? ? duration: 4,
? ? ? ? ? complete: function (e) {
? ? ? ? ? ? // 飞行完成回调方法
? ? ? ? ? ? // graphic.openPopup()
? ? ? ? ? }
? ? ? ? })
? ? ? }
? ? }
? })
? graphicLayer.bindPopup(function (event) {
? ? if (event.graphic.cluster && event.graphic.getGraphics) {
? ? ? const graphics = event.graphic.getGraphics() // 对应的grpahic数组,可以自定义显示
? ? ? if (graphics) {
? ? ? ? const inthtml = `单击了聚合点(${graphics.length}个)`
? ? ? ? return inthtml
? ? ? }
? ? }
? ? const item = event.graphic?.attr
? ? if (!item) {
? ? ? return false
? ? }
? ? const inthtml = `<table style="width: auto;">
? ? ? ? ? ? ? ? ? <tr>
? ? ? ? ? ? ? ? ? ? <th scope="col" colspan="2" style="text-align:center;font-size:15px;">${item.text} </th>
? ? ? ? ? ? ? ? ? </tr>
? ? ? ? ? ? ? ? ? <tr>
? ? ? ? ? ? ? ? ? ? <td>省:</td><td>${item.province}</td>
? ? ? ? ? ? ? ? ? </tr>
? ? ? ? ? ? ? ? ? <tr>
? ? ? ? ? ? ? ? ? ? <td>市:</td> <td>${item.city}</td>
? ? ? ? ? ? ? ? ? </tr>
? ? ? ? ? ? ? ? ? <tr>
? ? ? ? ? ? ? ? ? ? <td>县/区:</td> <td>${item.district}</td>
? ? ? ? ? ? ? ? ? </tr>
? ? ? ? ? ? ? ? ? <tr>
? ? ? ? ? ? ? ? ? ? <td>地址:</td> <td>${item.address}</td>
? ? ? ? ? ? ? ? ? </tr>
? ? ? ? ? ? ? ? ? <tr>
? ? ? ? ? ? ? ? ? ? <td>视频:</td> <td><video src='http://data.mars3d.cn/file/video/lukou.mp4' controls autoplay style="width: 300px;" ></video></td>
? ? ? ? ? ? ? ? ? </tr>
? ? ? ? ? ? ? ? </table>`
? ? return inthtml
? })
}
/**
?* 释放当前地图业务的生命周期函数
?* @returns {void} 无
?*/
export function onUnmounted() {
? graphicLayer.remove()
? graphicLayer = null
? map = null
}
// 计算贴地高度示例代码,可以将获取到的高度更新到数据库内,后续不用重复计算。
export function getDataSurfaceHeight() {
? if (graphicLayer.length === 0) {
? ? globalMsg("数据尚未加载成功!")
? ? return
? }
? showLoading()
? // 对图层内的数据做贴地运算,自动得到贴地高度
? graphicLayer.autoSurfaceHeight().then((graphics) => {
? ? hideLoading()
? ? const arr = []
? ? for (let i = 0, len = graphics.length; i < len; i++) {
? ? ? const graphic = graphics[i]
? ? ? const point = graphic.point
? ? ? arr.push({
? ? ? ? ...graphic.attr,
? ? ? ? lat: point.lat,
? ? ? ? lng: point.lng,
? ? ? ? z: point.alt
? ? ? })
? ? }
? ? mars3d.Util.downloadFile("point.json", JSON.stringify({ data: arr }))
? })
}
export function enabledAggressive(val) {
? graphicLayer.clustering = val
}
export function layerShowChange(val) {
? graphicLayer.show = val
}
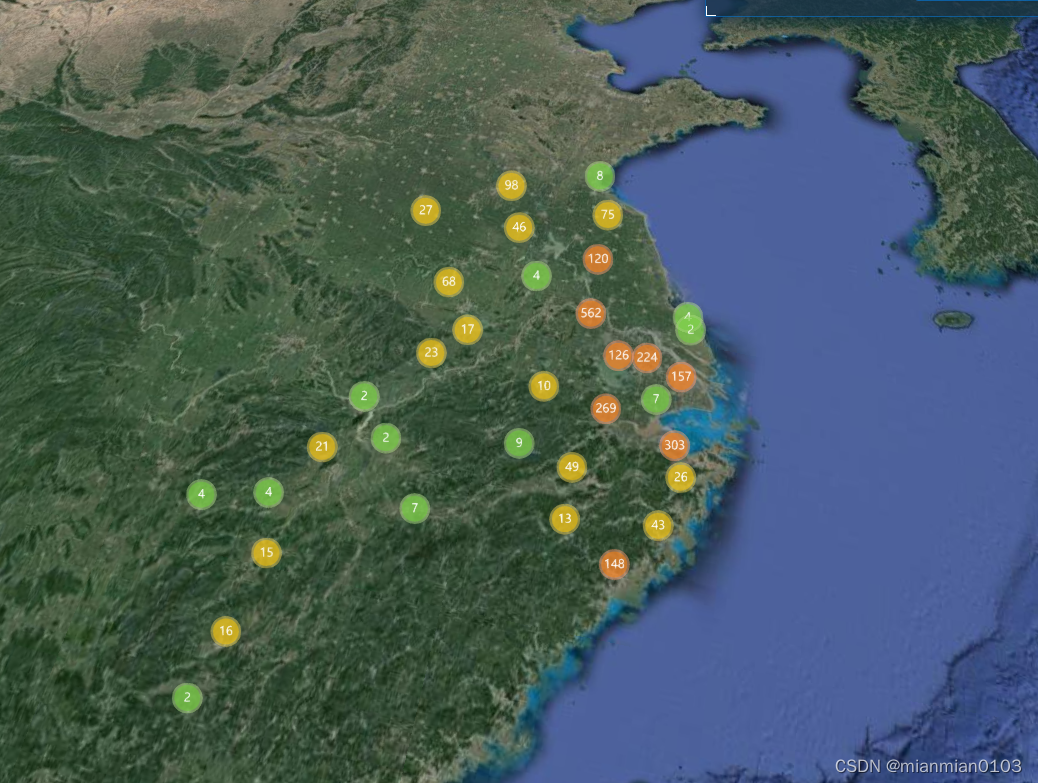
实现效果:


本文来自互联网用户投稿,该文观点仅代表作者本人,不代表本站立场。本站仅提供信息存储空间服务,不拥有所有权,不承担相关法律责任。 如若内容造成侵权/违法违规/事实不符,请联系我的编程经验分享网邮箱:chenni525@qq.com进行投诉反馈,一经查实,立即删除!