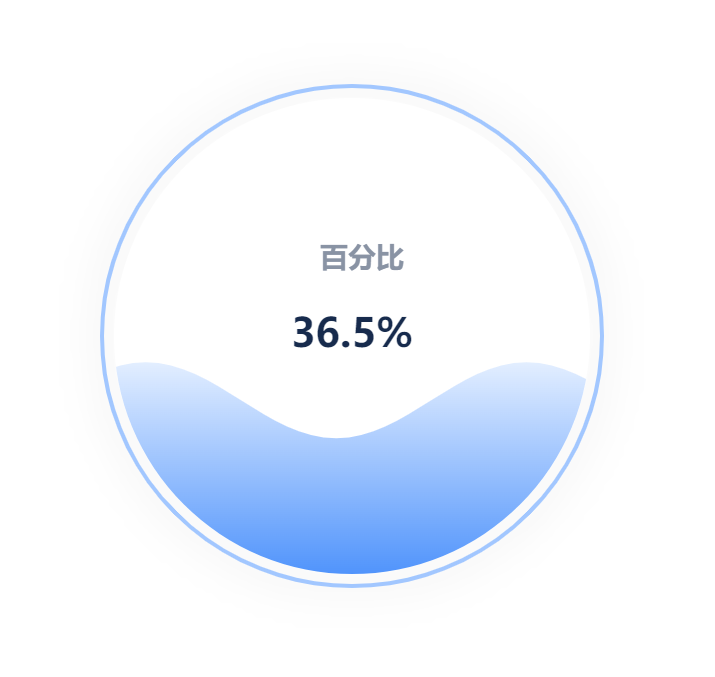
【Eachrts】水滴图
发布时间:2023年12月20日
引入依赖
npm安装echarts、echarts-liquidfill插件
"echarts": "^5.4.2",
"echarts-liquidfill": "^3.1.0",
引入插件
import * as echarts from 'echarts';
import 'echarts-liquidfill';
示例

<template>
  <div class="LiquidChart">
    <div ref="liquid_chart" style="width: 500px; height: 500px; "></div>
  </div>
</template>

<script>
import * as echarts from 'echarts';
import 'echarts-liquidfill';
export default {
  methods: {
    initLiquidChart1() {
      let chart = echarts.init(this.$refs.liquid_chart);
      let rateData = [0.365];
      let option = {
        title: [
          {
            text: '百分比',
            textAlign: 'center',
            top: '40%',
            left: '50%',
            textStyle: {
              color: '#8993A4',
              fontSize: 14,
            },
          },
        ],
        grid: {
          left: '0',
        },
        label: {
          formatter(params) {
            return (params.value * 100).toFixed(1) + '%';
          },
        },
        series: [
          {
            name: '百分比',
            type: 'liquidFill',
            data: rateData,
            label: {
              fontSize: 20,
              color: '#172B4D',
            },
            radius: '50%',
            //水波
            color: [
              new echarts.graphic.LinearGradient(0, 0, 0, 1, [
                {
                  offset: 0,
                  color: '#E1EDFF',
                },
                {
                  offset: 1,
                  color: '#478EFB',
                },
              ]),
            ],
            itemStyle: {
              //opacity: 0.7, // 波浪的透明度
              shadowBlur: 0, // 波浪的阴影范围
            },
            // 外环
            outline: {
              borderDistance: 5,
              itemStyle: {
                borderWidth: 2,
                borderColor: '#A2C7FF',
              },
            },
            backgroundStyle: {
              color: '#FFFFFF',
            },
          },
        ],
      };
      chart.setOption(option);
    },
  },
  mounted() {
    this.initLiquidChart1();
  },
};
</script>
文章来源:https://blog.csdn.net/Trista_1999/article/details/135115527
本文来自互联网用户投稿,该文观点仅代表作者本人,不代表本站立场。本站仅提供信息存储空间服务,不拥有所有权,不承担相关法律责任。 如若内容造成侵权/违法违规/事实不符,请联系我的编程经验分享网邮箱:chenni525@qq.com进行投诉反馈,一经查实,立即删除!
本文来自互联网用户投稿,该文观点仅代表作者本人,不代表本站立场。本站仅提供信息存储空间服务,不拥有所有权,不承担相关法律责任。 如若内容造成侵权/违法违规/事实不符,请联系我的编程经验分享网邮箱:chenni525@qq.com进行投诉反馈,一经查实,立即删除!