MATLAB Fundamentals>>>Smoothing Data with Moving Average
发布时间:2024年01月22日
MATLAB Fundamentals>Common Data Analysis Techniques>Smoothing Data> (2/5)?Smoothing Data with Moving Average
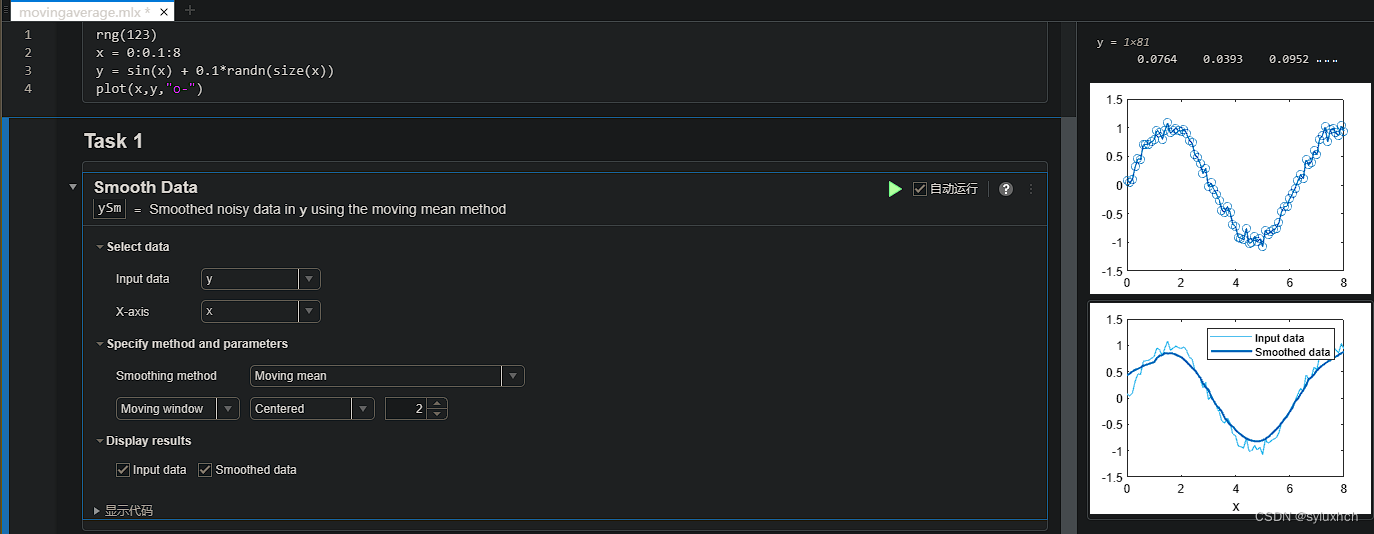
例1:
Smoothing method:Moving mean
Moving window:Centered 2

代码2:
% Smooth input data
ySm = smoothdata(y,"movmean",2,"SamplePoints",x);

% Display results
figure
plot(x,y,"SeriesIndex",6,"DisplayName","Input data")
hold on
plot(x,ySm,"SeriesIndex",1,"LineWidth",1.5, ...
    "DisplayName","Smoothed data")
hold off
legend
xlabel("x")
例2:
Smoothing method:Moving mean
Smoothing factor:0.25
 代码2:
代码2:
% Smooth input data
ySm = smoothdata(y,"movmean","SmoothingFactor",0.25,"SamplePoints",x);

% Display results
figure
plot(x,y,"SeriesIndex",6,"DisplayName","Input data")
hold on
plot(x,ySm,"SeriesIndex",1,"LineWidth",1.5, ...
    "DisplayName","Smoothed data")
hold off
legend
xlabel("x")
例3:
Smoothing method:Moving median
Moving window:Centered 2

代码3:
% Smooth input data
ySm = smoothdata(y,"movmedian",2,"SamplePoints",x);

% Display results
figure
plot(x,y,"SeriesIndex",6,"DisplayName","Input data")
hold on
plot(x,ySm,"SeriesIndex",1,"LineWidth",1.5, ...
    "DisplayName","Smoothed data")
hold off
legend
xlabel("x")
例4:
Smoothing method:Gaussian filter
Moving window:Centered 2

代码4:
% Smooth input data
ySm = smoothdata(y,"gaussian",2,"SamplePoints",x);

% Display results
figure
plot(x,y,"SeriesIndex",6,"DisplayName","Input data")
hold on
plot(x,ySm,"SeriesIndex",1,"LineWidth",1.5, ...
    "DisplayName","Smoothed data")
hold off
legend
xlabel("x")
例5:
Smoothing method:Local linear regression(lowess)
Moving window:Centered 2

代码5:
% Smooth input data
ySm = smoothdata(y,"lowess",2,"SamplePoints",x);

% Display results
figure
plot(x,y,"SeriesIndex",6,"DisplayName","Input data")
hold on
plot(x,ySm,"SeriesIndex",1,"LineWidth",1.5, ...
    "DisplayName","Smoothed data")
hold off
legend
xlabel("x")
例6:
Smoothing method:Local quadratic?regression(loess)
Moving window:Centered 2

代码6:
% Smooth input data
ySm = smoothdata(y,"loess",2,"SamplePoints",x);

% Display results
figure
plot(x,y,"SeriesIndex",6,"DisplayName","Input data")
hold on
plot(x,ySm,"SeriesIndex",1,"LineWidth",1.5, ...
    "DisplayName","Smoothed data")
hold off
legend
xlabel("x")
例7:
Smoothing method:Robust Lowess
Moving window:Centered 2

代码7:
% Smooth input data
ySm = smoothdata(y,"rlowess",2,"SamplePoints",x);

% Display results
figure
plot(x,y,"SeriesIndex",6,"DisplayName","Input data")
hold on
plot(x,ySm,"SeriesIndex",1,"LineWidth",1.5, ...
    "DisplayName","Smoothed data")
hold off
legend
xlabel("x")
例8:
Smoothing method:Roubst Loess
Moving window:Centered 2

代码8:
% Smooth input data
ySm = smoothdata(y,"rloess",2,"SamplePoints",x);

% Display results
figure
plot(x,y,"SeriesIndex",6,"DisplayName","Input data")
hold on
plot(x,ySm,"SeriesIndex",1,"LineWidth",1.5, ...
    "DisplayName","Smoothed data")
hold off
legend
xlabel("x")
例9:
Smoothing method:Savitzky-Golay polynomial filter
polynomial degree:2
Moving window:Centered 2

代码9:
% Smooth input data
ySm = smoothdata(y,"sgolay",2,"SamplePoints",x);

% Display results
figure
plot(x,y,"SeriesIndex",6,"DisplayName","Input data")
hold on
plot(x,ySm,"SeriesIndex",1,"LineWidth",1.5, ...
    "DisplayName","Smoothed data")
hold off
legend
xlabel("x")
文章来源:https://blog.csdn.net/syluxhch/article/details/135741018
本文来自互联网用户投稿,该文观点仅代表作者本人,不代表本站立场。本站仅提供信息存储空间服务,不拥有所有权,不承担相关法律责任。 如若内容造成侵权/违法违规/事实不符,请联系我的编程经验分享网邮箱:chenni525@qq.com进行投诉反馈,一经查实,立即删除!
本文来自互联网用户投稿,该文观点仅代表作者本人,不代表本站立场。本站仅提供信息存储空间服务,不拥有所有权,不承担相关法律责任。 如若内容造成侵权/违法违规/事实不符,请联系我的编程经验分享网邮箱:chenni525@qq.com进行投诉反馈,一经查实,立即删除!