mvtec3d
发布时间:2023年12月26日
以bagel为例,其中有calibration、
bagel			# 百吉圈(硬面包)
	calibration
		camera_parameters.json
	test
		combined
			gt	# 缺陷部位的分割剪影png
			rgb	# 原图png
			xyz	# tiff
		contamination	# 污染物
			同上
		crack
			同上
		good
			同上
		hole
			同上
	train
		good
			rgb
			xyz
	validation
		good
			同train
	class_ids.json
camera_parameters.json
{
  "camera_type": "area_scan_division",
  "focus": 0.0103431,
  "kappa": -2205.03,
  "sx": 3.74983e-06,
  "sy": 3.75e-06,
  "cx": 252.046,
  "cy": 450.07,
  "image_width": 800,
  "image_height": 800
}
class_ids.json如下
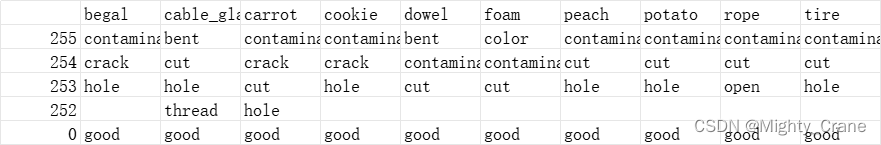
其余类别
cable_gland	缆线接头,缺陷:弯曲、末端破裂或者头部凹陷、洞、螺纹损坏
carrot	胡萝卜,缺陷:污染、裂纹、割痕、洞
cookie	饼干
dowel	暗榫(识图的话应该叫塑料膨胀管)
foam	鸡蛋托盘
peach
potato
rope	绞绳,缺陷:污染、裂痕、蓬松
tire
顺便记一下在gpt那问到的处理tiff的代码,可能用到?
import tifffile as tiff

# Attempt to read the TIFF file using tifffile
try:
    tiff_data = tiff.imread(file_path)
    # Display the shape of the array to understand its dimensions
    tiff_data_shape = tiff_data.shape
except Exception as e:
    tiff_data_shape = str(e)

tiff_data_shape
(800, 800, 3)
要从这种类型的图像中生成点云,我们可以遵循以下步骤:
将图像转换为灰度图。 遍历每个像素,使用其 x 和 y 坐标以及灰度值(作为 z 坐标)来生成点云。
我将进行这些转换并提供一个点云数据的示例。 ??# Convert the image to grayscale gray_image = np.mean(tiff_data, axis=2) # Generate point cloud data points = [] for y in range(gray_image.shape[0]): for x in range(gray_image.shape[1]): z = gray_image[y][x] # Grayscale value as height points.append([x, y, z]) # Convert to numpy array for better handling point_cloud = np.array(points) # Show the shape of the point cloud and a small sample of the data point_cloud_shape = point_cloud.shape point_cloud_sample = point_cloud[:5] # First 5 points as a sample point_cloud_shape, point_cloud_sample((640000, 3), array([[0. , 0. , 0.14262693], [1. , 0. , 0.14268805], [2. , 0. , 0.14277673], [3. , 0. , 0.14286469], [4. , 0. , 0.14295126]]))成功将图像转换为点云数据。生成的点云由 640,000 个点组成,每个点有三个坐标:x, y, 和 z。
这些坐标中,x 和 y 是像素的位置,而 z 是基于灰度值的高度(或深度)。现在你可以使用 CloudCompare、MeshLab 或其他点云可视化工具来查看和分析这些数据。如果你选择使用 Python 进行可视化,可以使用 matplotlib、plotly 或类似库来创建三维散点图。
文章来源:https://blog.csdn.net/weixin_40459958/article/details/135137398
本文来自互联网用户投稿,该文观点仅代表作者本人,不代表本站立场。本站仅提供信息存储空间服务,不拥有所有权,不承担相关法律责任。 如若内容造成侵权/违法违规/事实不符,请联系我的编程经验分享网邮箱:chenni525@qq.com进行投诉反馈,一经查实,立即删除!
本文来自互联网用户投稿,该文观点仅代表作者本人,不代表本站立场。本站仅提供信息存储空间服务,不拥有所有权,不承担相关法律责任。 如若内容造成侵权/违法违规/事实不符,请联系我的编程经验分享网邮箱:chenni525@qq.com进行投诉反馈,一经查实,立即删除!
最新文章
- Python教程
- 深入理解 MySQL 中的 HAVING 关键字和聚合函数
- Qt之QChar编码(1)
- MyBatis入门基础篇
- 用Python脚本实现FFmpeg批量转换
- react-native 配置@符号绝对路径配置和绝对路径没有提示的问题
- 大型食品企业-白象集团选择泛微搭建集团一体化的数字化办公平台
- 电子学会scratch四级2023年9月24题—小小情报员
- R语言【taxa】——classification():储存分类树的分类信息
- 【无标题】
- 精准掌控 Git 忽略规则:定制化 .gitignore 指南
- 【mysql django】解决Django提示mysql版本过低
- ES6的一些冷门实用操作
- 遭遇.360、.halo勒索病毒:应对.360、.halo勒索病毒的最佳方法
- 视频号小店做不起来?万法一门!分享两个做视频号小店的建议!