MATLAB中确定峰宽
发布时间:2023年12月25日
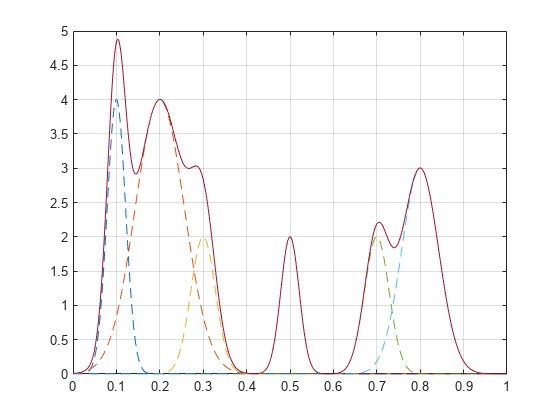
????????创建由钟形曲线之和组成的信号。指定每条曲线的位置、高度和宽度。
x = linspace(0,1,1000);

Pos = [1 2 3 5 7 8]/10;
Hgt = [4 4 2 2 2 3];
Wdt = [3 8 4 3 4 6]/100;

for n = 1:length(Pos)
    Gauss(n,:) =  Hgt(n)*exp(-((x - Pos(n))/Wdt(n)).^2);
end

PeakSig = sum(Gauss);
????????绘制各单条曲线及其总和。
plot(x,Gauss,'--',x,PeakSig)
grid
如图所示:
在相对高差的一半处测量波峰的宽度。
findpeaks(PeakSig,x,'Annotate','extents')如图所示:

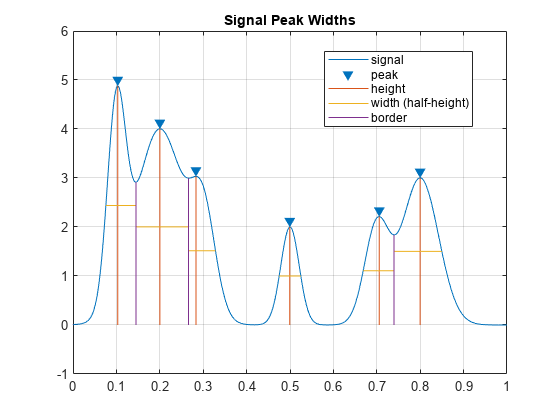
????????再次测量宽度,这次在半高处测量。
findpeaks(PeakSig,x,'Annotate','extents','WidthReference','halfheight')
title('Signal Peak Widths')
????????如图所示:
文章来源:https://blog.csdn.net/jk_101/article/details/134421353
本文来自互联网用户投稿,该文观点仅代表作者本人,不代表本站立场。本站仅提供信息存储空间服务,不拥有所有权,不承担相关法律责任。 如若内容造成侵权/违法违规/事实不符,请联系我的编程经验分享网邮箱:chenni525@qq.com进行投诉反馈,一经查实,立即删除!
本文来自互联网用户投稿,该文观点仅代表作者本人,不代表本站立场。本站仅提供信息存储空间服务,不拥有所有权,不承担相关法律责任。 如若内容造成侵权/违法违规/事实不符,请联系我的编程经验分享网邮箱:chenni525@qq.com进行投诉反馈,一经查实,立即删除!
最新文章