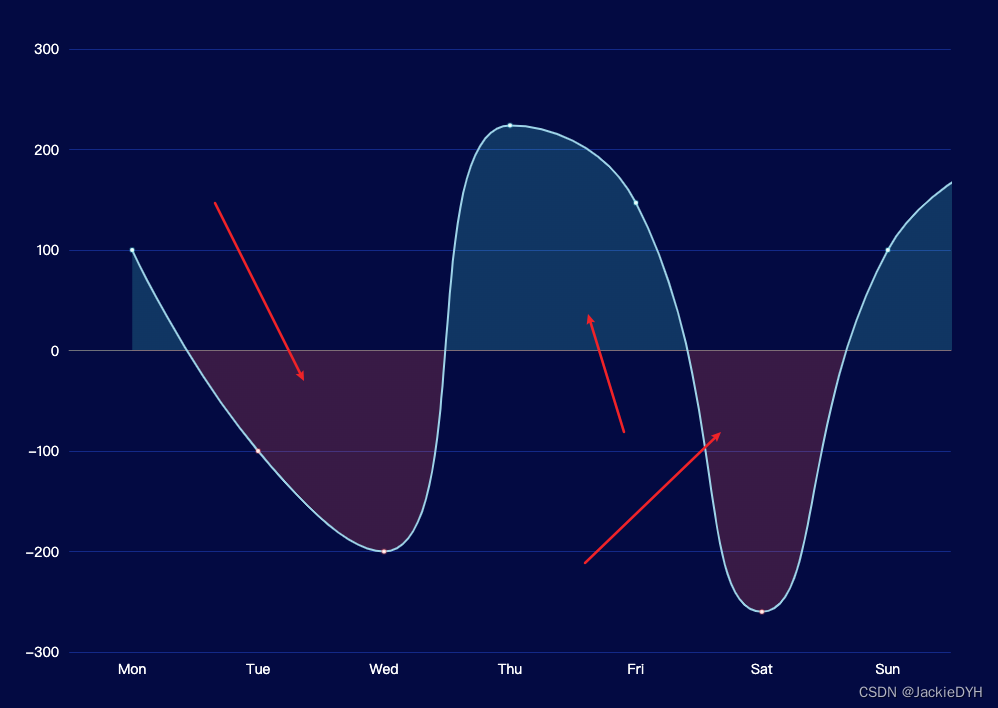
Echarts折线图中数据根据正负数显示不同区域背景色-配置
发布时间:2024年01月15日
示例

 ?
?
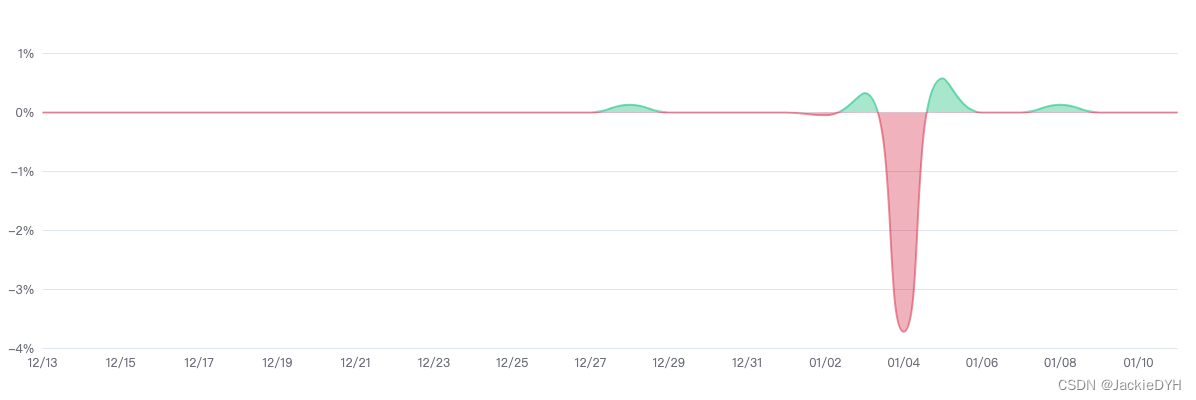
Echarts折线图中数据根据正负数显示不同区域背景色?
- ?Piecewise 分段类型
- Continuous 连续类型
Echarts配置
option = {
  backgroundColor: "#030A41",
  xAxis: {
    type: 'category',
    data: ['Mon', 'Tue', 'Wed', 'Thu', 'Fri', 'Sat', 'Sun'],
    axisTick: {
      show: false,
    },
    axisLabel: {  //设置x轴坐标配置
            margin: 10,
            color: '#fff',
            textStyle: {
                fontSize: 14
            },
        },
  },
  yAxis: {   //设置y轴坐标配置
    type: 'value',
    splitLine: {
      show: true,
      lineStyle: {
        color: '#132987',
      },
    },
    axisLabel: {
            margin: 10,
            color: '#fff',  //y轴坐标文字颜色设置
            textStyle: {
                fontSize: 14
            },
        },
  },
 visualMap: [
    {
      type: 'piecewise',
      show: false,
      pieces: [
        {
          lte: 0,   //数据<0配置
          color: 'rgba(255, 87, 87, 0.3)',  //设置区域背景色
        },
        {
          gte: 0.1,  //数据>0配置
          color: 'rgba(69, 215, 224, 0.3)',  //设置区域背景色
        },
      ],
      seriesIndex: 0,
    },
  ],
  series: [
    {
      data: [100,-100, -200, 224, 147, -260,100,200],
      type: 'line',
      smooth: true,
      symbol: 'none', //'circle' 圆点
      sampling: 'average',
      areaStyle: {}
      // itemStyle: {
      //   normal: {
      //     lineStyle: {
      //       width: 2,
      //       color: '#9DD3E8'
      //     }
      //   }
      // }
    }
  ]
};
?完整使用
import * as echarts from 'echarts';

var chartDom = document.getElementById('main');
var myChart = echarts.init(chartDom);
var option;

option = {
  backgroundColor: '#030A41',
  xAxis: {
    type: 'category',
    data: ['Mon', 'Tue', 'Wed', 'Thu', 'Fri', 'Sat', 'Sun'],
    axisTick: {
      show: false
    },
    axisLabel: {
      //设置x轴坐标配置
      margin: 10,
      color: '#fff',
      textStyle: {
        fontSize: 14
      }
    }
  },
  yAxis: {
    //设置y轴坐标配置
    type: 'value',
    splitLine: {
      show: true,
      lineStyle: {
        color: '#132987'
      }
    },
    axisLabel: {
      margin: 10,
      color: '#fff', //y轴坐标文字颜色设置
      textStyle: {
        fontSize: 14
      }
    }
  },
  visualMap: [
    {
      type: 'piecewise',
      show: false,
      pieces: [
        {
          lte: 0, //数据<0配置
          color: 'rgba(255, 87, 87, 0.3)' //设置区域背景色
        },
        {
          gte: 0.1, //数据>0配置
          color: 'rgba(69, 215, 224, 0.3)' //设置区域背景色
        }
      ],
      seriesIndex: 0
    }
  ],
  series: [
    {
      data: [100, -100, -200, 224, 147, -260, 100, 200],
      type: 'line',
      smooth: true,
      symbol: 'none', //'circle' 圆点
      sampling: 'average',
      areaStyle: {}
      // itemStyle: {
      //   normal: {
      //     lineStyle: {
      //       width: 2,
      //       color: '#9DD3E8'
      //     }
      //   }
      // }
    }
  ]
};

option && myChart.setOption(option);
文章来源:https://blog.csdn.net/JackieDYH/article/details/135395711
本文来自互联网用户投稿,该文观点仅代表作者本人,不代表本站立场。本站仅提供信息存储空间服务,不拥有所有权,不承担相关法律责任。 如若内容造成侵权/违法违规/事实不符,请联系我的编程经验分享网邮箱:chenni525@qq.com进行投诉反馈,一经查实,立即删除!
本文来自互联网用户投稿,该文观点仅代表作者本人,不代表本站立场。本站仅提供信息存储空间服务,不拥有所有权,不承担相关法律责任。 如若内容造成侵权/违法违规/事实不符,请联系我的编程经验分享网邮箱:chenni525@qq.com进行投诉反馈,一经查实,立即删除!
最新文章
- Python教程
- 深入理解 MySQL 中的 HAVING 关键字和聚合函数
- Qt之QChar编码(1)
- MyBatis入门基础篇
- 用Python脚本实现FFmpeg批量转换
- Nginx三种虚拟主机配置
- 伊恩·斯图尔特《改变世界的17个方程》波动方程笔记
- 6-183 Delete node from singly liked list
- RabbitMQ的关键概念解析
- Spark: 检查数据倾斜的方法以及解决方法总结
- 量化交易学习笔记:XGBoost 在量化选股中的应用
- SpringIOC之ApplicationContextAwareProcessor
- Python基础练习题附带解题思路与代码
- EasyExcel
- 美信科技&盘古信息智能车间项目成功验收,打造电子元器件数字化工厂标杆