前端进阶-可视化(echarts)
发布时间:2024年01月07日
1.引入echarts 到vue3 工程
import * as echarts from 'echarts'
app.config.globalProperties.$echarts = echarts
2.各种图形绘制:
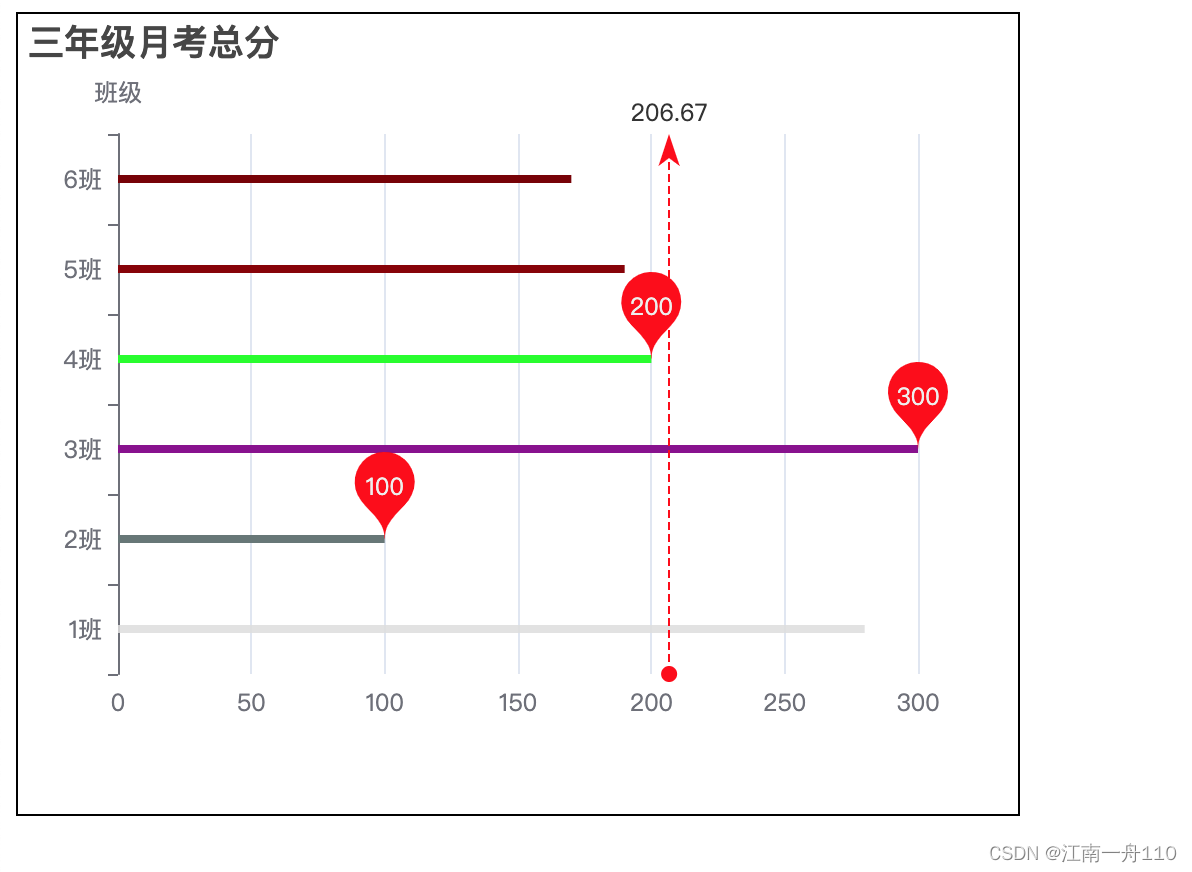
1.柱状图:
<template>
  <div>
    <div class="chartbox" ref="box"></div>
  </div>
</template>

<script setup>
import { getCurrentInstance, ref, onMounted } from "vue";
const myChart = getCurrentInstance().proxy.$echarts;

const box = ref();
onMounted(() => {
  let barChart = myChart.init(box.value);

  let xDatas = ["1班", "2班", "3班", "4班", "5班", "6班"];

  let datas = [280, 100, 300, 200, 190, 170];

  let opts = {
    title: {
      text: "三年级月考总分",
    },
    tooltip: {},
    // xAxis: {
    //   data: xDatas,
    //   type: "category", //默认值category
    //   name: "班级",
    // },
    xAxis: {},

    //水平柱状图 x,y交互
    // yAxis: {},
    yAxis: {
      data: xDatas,
      type: "category", //默认值category
      name: "班级",
    },
    series: [
      {
        data: datas,
        type: "bar",
        name: "成绩",
        barWidth: 4, //设置宽度
        color: "red", //设置轴颜色

        itemStyle: {
          //优先级高于外面的color,设置每个轴的颜色
          color: function (params) {
            console.log("parms", params);
            const colors = [
              "#dddd",
              "#677777",
              "#890090",
              "#00ff00",
              "#890000",
              "#780000",
            ];
            return colors[params.dataIndex];
          },
        },
        //最大值,最小值
        markPoint: {
          data: [
            {
              type: "max",
              name: "最大值",
            },
            {
              type: "min",
              name: "最小值",
            },
            {
              type: "average",
              name: "平均值",
            },
          ],
        },
        //图表标线
        markLine: {
          data: [
            {
              type: "average",
              name: "平均值",
            },
          ],
        },
      },
    ],
  };
  barChart.setOption(opts);
});
</script>

<style lang="scss" scoped>
.chartbox {
  width: 500px;
  height: 400px;
  border: 1px solid;
}
</style>
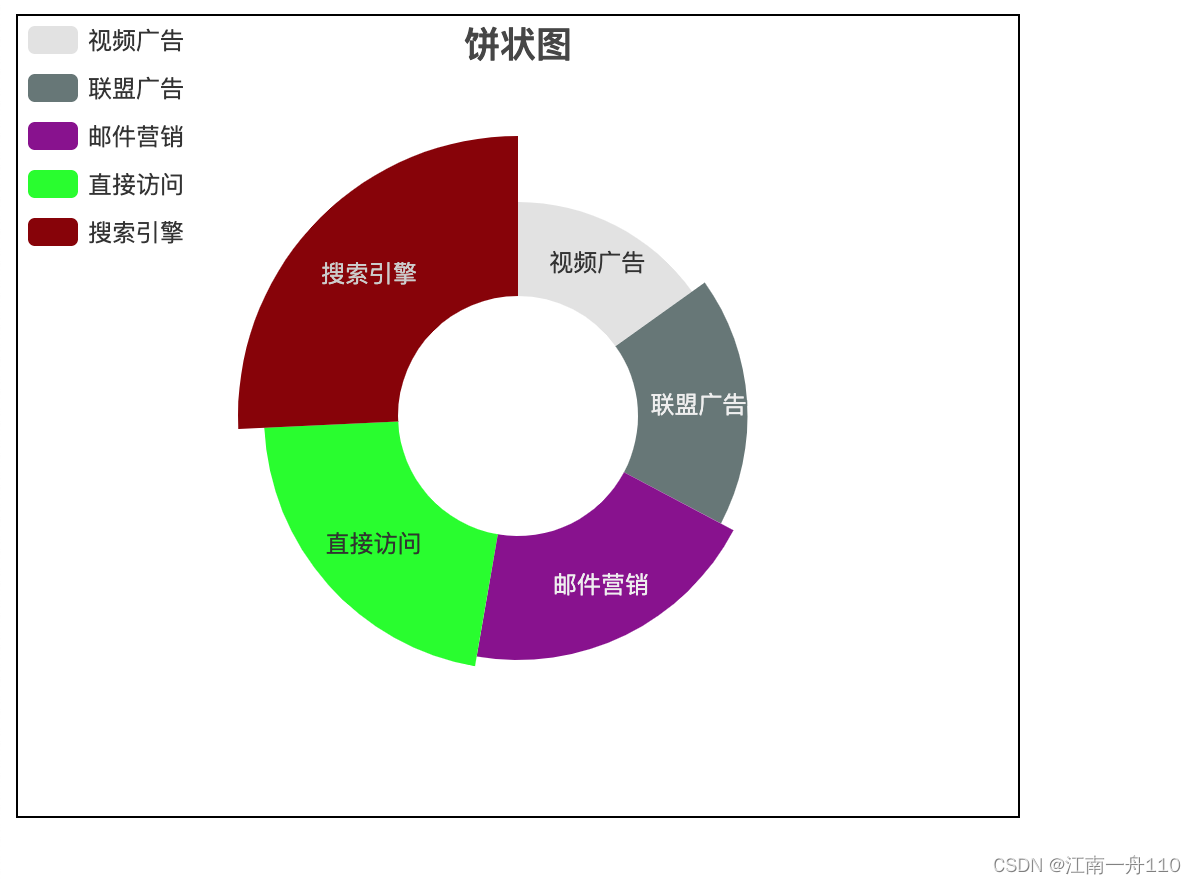
2.饼状图:
<template>
  <div ref="piebox" class="box"></div>
</template>

<script setup>
import { ref, onMounted, getCurrentInstance } from "vue";
const piebox = ref();
const { proxy } = getCurrentInstance();
onMounted(() => {
  let myCharts = proxy.$echarts.init(piebox.value);

  //饼状图没有 二维不需要 x  y
  let opts = {
    title: {
      text: "饼状图",
      x: "center",
    },
    legend: {
      left: "left",
      //图例列表的布局朝向。
      orient: "vertical",
    },
    series: [
      {
        name: "访问来源",
        type: "pie", //设置饼状图
        // radius: "55%",
        radius: ["30%", "70%"], //设置内外半径,就是环形图了
        roseType: "radius", //设置成南丁格尔图
        //饼图图形上的文本标签,
        label: {
          show: true,
          //标签的位置。
          position: "inside",
        },
        itemStyle: {
          //优先级高于外面的color,设置每个轴的颜色
          color: function (params) {
            console.log("parms", params);
            const colors = [
              "#dddd",
              "#677777",
              "#890090",
              "#00ff00",
              "#890000",
              "#780000",
            ];
            return colors[params.dataIndex];
          },
        },
        data: [
          { value: 235, name: "视频广告" },
          { value: 274, name: "联盟广告" },
          { value: 310, name: "邮件营销" },
          { value: 335, name: "直接访问" },
          { value: 400, name: "搜索引擎" },
        ],
      },
    ],
  };
  myCharts.setOption(opts);
});
</script>

<style lang="scss" scoped>
.box {
  width: 500px;
  height: 400px;
  border: 1px solid;
}
</style>
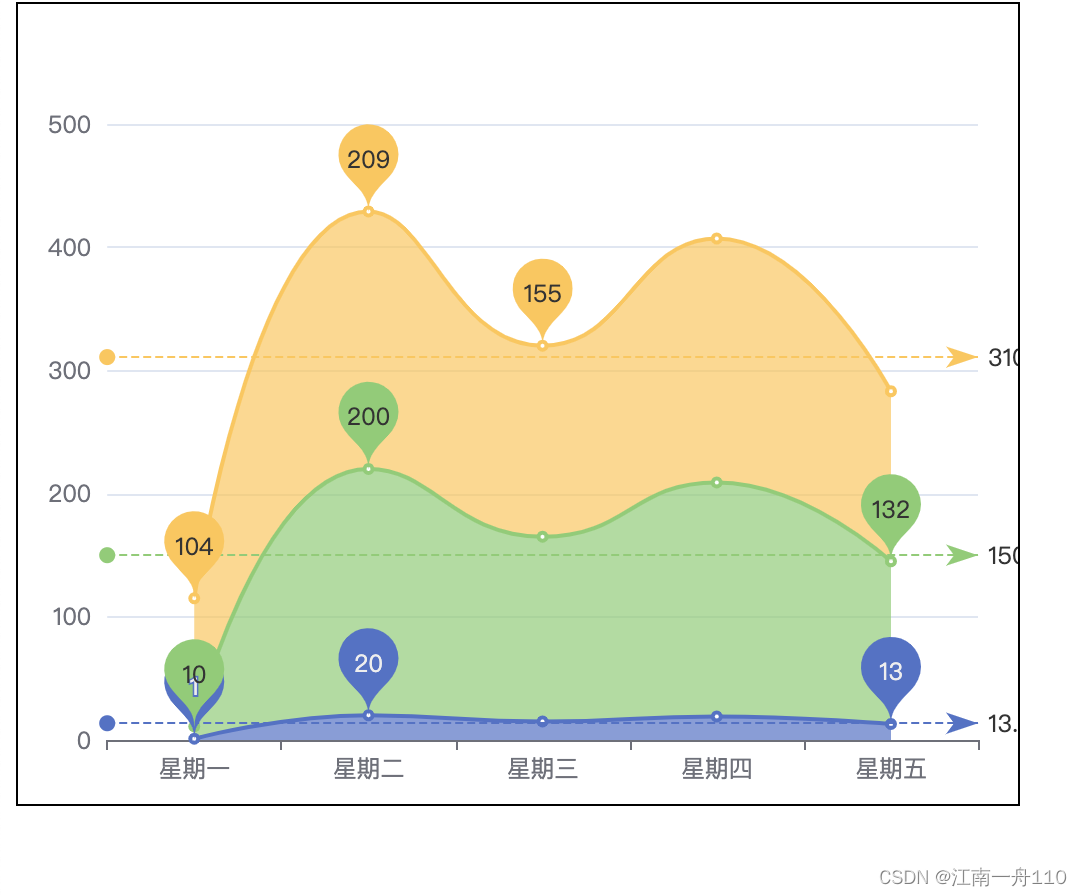
3.折线图
<template>
  <div ref="mychart" class="box"></div>
</template>

<script setup>
import { ref, onMounted, getCurrentInstance } from "vue";

const mychart = ref();
const { proxy } = getCurrentInstance();
onMounted(() => {
  let mylineChart = proxy.$echarts.init(mychart.value);
  let xDatas = ["星期一", "星期二", "星期三", "星期四", "星期五"];
  let data = [1, 20, 15, 19, 13];
  let data1 = [10, 200, 150, 190, 132];
  let data2 = [104, 209, 155, 198, 138];

  let opts = {
    xAxis: {
      data: xDatas,
    },
    tooltip: {},
    yAxis: {},
    grid: {
      left: "3%",
      right: "4%",
      bottom: "3%",
      containLabel: true,
    },
    series: [
      {
        data,
        type: "line",
        stack: "Total", //数据堆叠
        smooth: true, //平滑曲线。
        areaStyle: {}, //内容填充
        //最大值,最小值
        //高亮状态

        ellipsis: {
          focus: "series",
        },
        markPoint: {
          data: [
            {
              type: "max",
              name: "最大值",
            },
            {
              type: "min",
              name: "最小值",
            },
            {
              type: "average",
              name: "平均值",
            },
          ],
        },
        //图表标线
        markLine: {
          data: [
            {
              type: "average",
              name: "平均值",
            },
          ],
        },
      },
      {
        data: data1,
        type: "line",
        stack: "Total",
        smooth: true, //平滑曲线。
        areaStyle: {}, //内容填充
        //最大值,最小值
        ellipsis: {
          focus: "series",
        },
        markPoint: {
          data: [
            {
              type: "max",
              name: "最大值",
            },
            {
              type: "min",
              name: "最小值",
            },
            {
              type: "average",
              name: "平均值",
            },
          ],
        },
        //图表标线
        markLine: {
          data: [
            {
              type: "average",
              name: "平均值",
            },
          ],
        },
      },
      {
        data: data2,
        type: "line",
        stack: "Total",
        smooth: true, //平滑曲线。
        areaStyle: {}, //内容填充
        //最大值,最小值
        ellipsis: {
          focus: "series",
        },
        markPoint: {
          data: [
            {
              type: "max",
              name: "最大值",
            },
            {
              type: "min",
              name: "最小值",
            },
            {
              type: "average",
              name: "平均值",
            },
          ],
        },
        //图表标线
        markLine: {
          data: [
            {
              type: "average",
              name: "平均值",
            },
          ],
        },
      },
    ],
  };

  mylineChart.setOption(opts);
});
</script>

<style lang="scss" scoped>
.box {
  width: 500px;
  height: 400px;
  border: 1px solid;
}
</style>
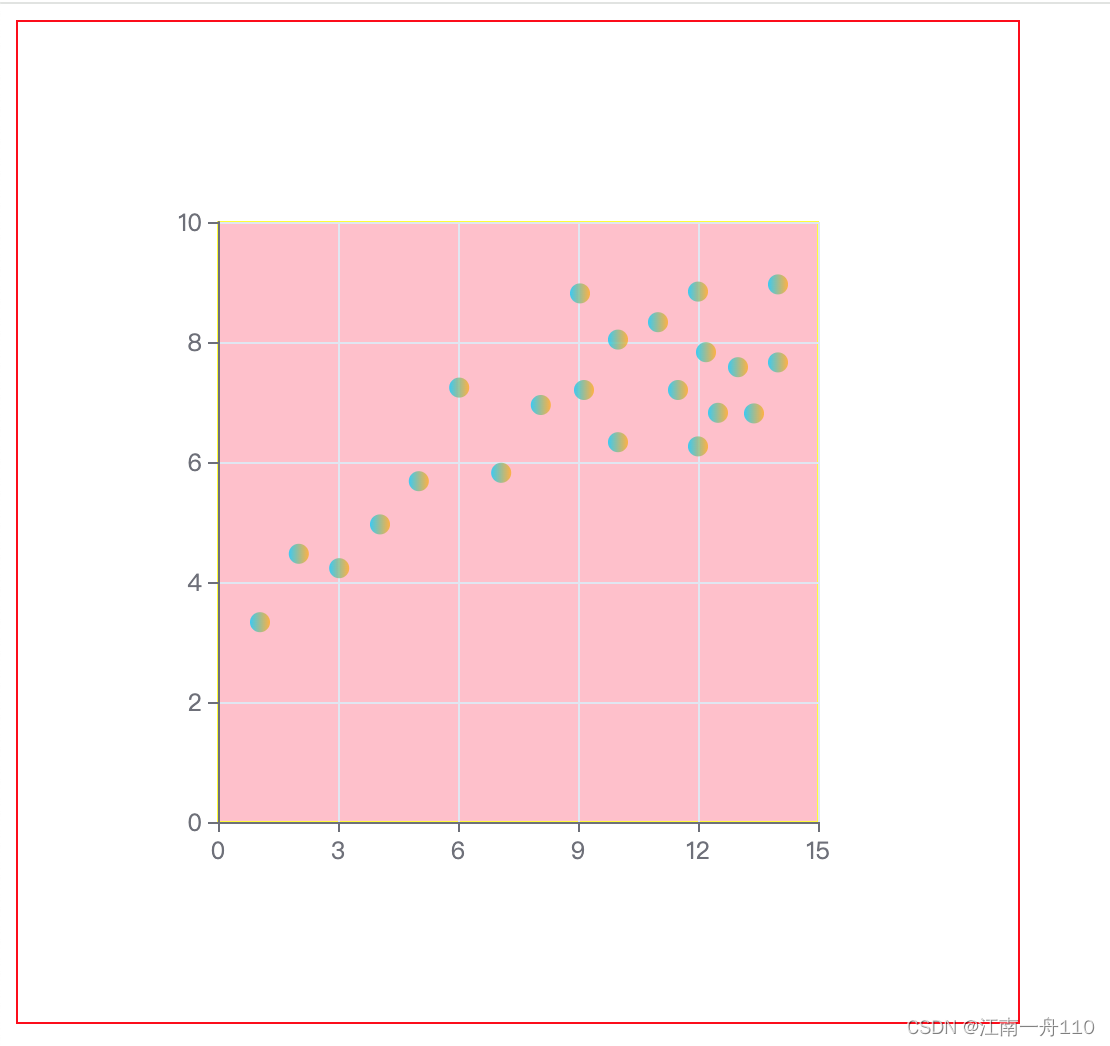
4.散点图
<template>
  <div ref="mybox" class="box"></div>
</template>

<script setup>
import { ref, getCurrentInstance, onMounted } from "vue";

const { proxy } = getCurrentInstance();
const mybox = ref();
onMounted(function () {
  const chart = proxy.$echarts.init(mybox.value);

  let data = [
    [10.0, 8.04],
    [8.07, 6.95],
    [13.0, 7.58],
    [9.05, 8.81],
    [11.0, 8.33],
    [14.0, 7.66],
    [13.4, 6.81],
    [10.0, 6.33],
    [14.0, 8.96],
    [12.5, 6.82],
    [9.15, 7.2],
    [11.5, 7.2],
    [3.03, 4.23],
    [12.2, 7.83],
    [2.02, 4.47],
    [1.05, 3.33],
    [4.05, 4.96],
    [6.03, 7.24],
    [12.0, 6.26],
    [12.0, 8.84],
    [7.08, 5.82],
    [5.02, 5.68],
  ];
  let opts = {
    xAxis: {},
    yAxis: {},
    tooltip: {},

    //直角坐标系内绘图网格
    grid: {
      show: true,
      left: "20%",
      top: "20%",
      right: "20%",
      bottom: "20%",
      backgroundColor: "pink",
      borderColor: "yellow",
    },

    series: [
      {
        // symbolSize: 23,

        data,
        type: "scatter", //散点图
        color: "red",

        //鼠标经过高亮
        emphasis: {
          itemStyle: {
            borderColor: "rgba(100,200,50,.5)",
            borderWidth: 30,
          },
        },
        //渐变
        color: {
          type: "linear",
          x: 0,
          y: 0,
          x2: 1,
          y2: 0,
          colorStops: [
            {
              offset: 0,
              color: "#00ccff",
            },
            {
              offset: 1,
              color: "rgba(255,173,2,.9)",
            },
          ],
        },
      },
    ],
  };

  chart.setOption(opts);
});
</script>

<style lang="scss" scoped>
.box {
  width: 500px;
  height: 500px;
  border: 1px solid red;
}
</style>
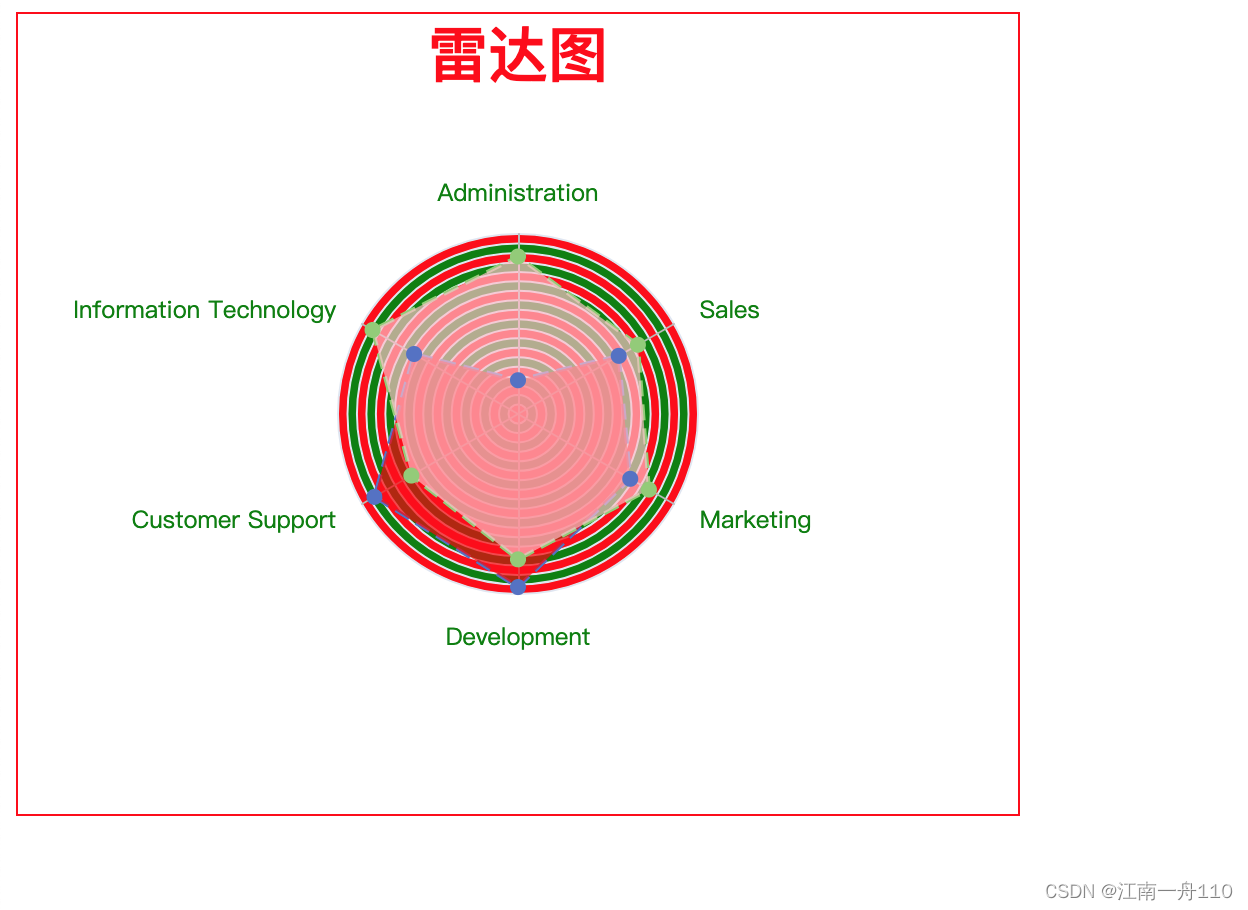
5.雷达图
<template>
  <div ref="chart" class="box"></div>
</template>

<script setup>
import { getCurrentInstance, ref, onMounted } from "vue";

const { proxy } = getCurrentInstance();
const chart = ref();
onMounted(() => {
  let myChart = proxy.$echarts.init(chart.value);
  let opts = {
    title: {
      text: "雷达图",
      x: "center",
      textStyle: {
        color: "red",
        fontWeight: 800,
        fontSize: 30,
      },
    },
    tooltip: {},
    // legend: {
    //   data: ["Allocated Budget", "Actual Spending"],
    // },
    radar: {
      shape: "circle", //设置形状
      //雷达图指示器
      indicator: [
        { name: "Sales", max: 6500 },
        { name: "Administration", max: 16000 },
        { name: "Information Technology", max: 30000 },
        { name: "Customer Support", max: 38000 },
        { name: "Development", max: 52000 },
        { name: "Marketing", max: 25000 },
      ],
      //设置半径

      radius: 90,
      //旋转角度
      startAngle: 30,

      //设置层级
      splitNumber: 19,
      axisName: {
        formatter: "{value}",
        color: "green",
      },
      splitArea: {
        //分割区样式
        areaStyle: {
          color: ["red", "green"],
          shadowColor: "0,0,0,.2",
          shadowBlur: 20,
        },
      },
    },
    series: [
      {
        name: "Budget vs spending",
        type: "radar", //雷达图
        data: [
          {
            value: [4200, 3000, 20000, 35000, 50000, 18000],
            name: "Allocated Budget",
            areaStyle: {
              color: "red",
            },
          },
          {
            value: [5000, 14000, 28000, 26000, 42000, 21000],
            name: "Actual Spending",
            areaStyle: {
              color: "pink",
            },
          },
        ],
        lineStyle: {
          type: "dashed",
        },
      },
    ],
  };

  opts && myChart.setOption(opts);
});
</script>

<style lang="scss" scoped>
.box {
  width: 500px;
  height: 400px;
  border: 1px solid red;
}
</style>
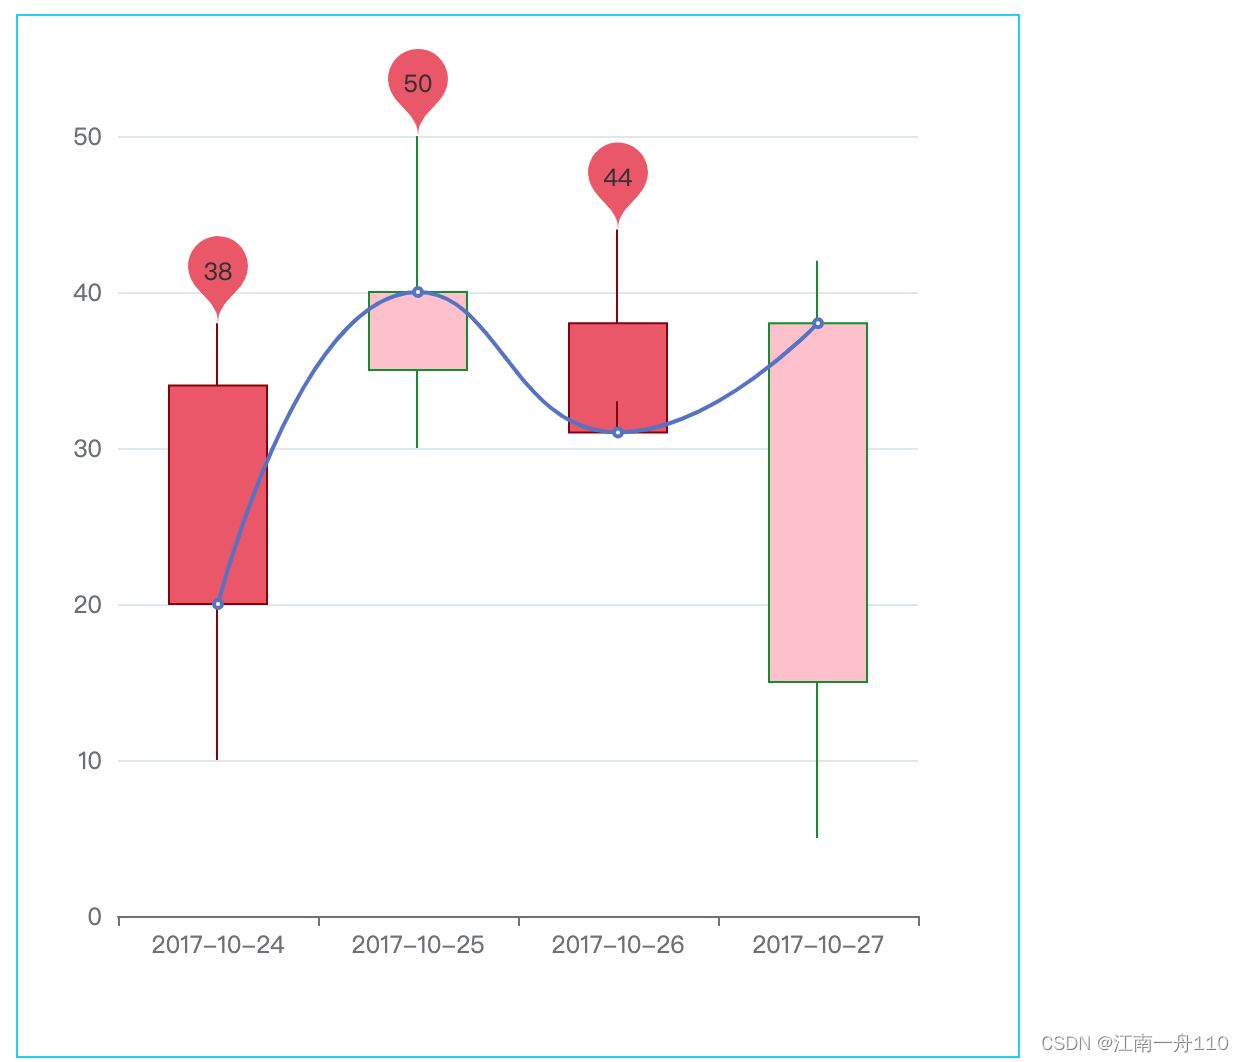
6.K线图
<template>
  <div ref="myChart" class="box"></div>
</template>

<script setup>
import { getCurrentInstance, ref, onMounted, computed } from "vue";

const { proxy } = getCurrentInstance();
let data = ref([
  [20, 34, 10, 38],
  [40, 35, 30, 50],
  [31, 38, 33, 44],
  [38, 15, 5, 42],
]);
const myChart = ref();
let klinedata = computed(() => {
  return data.value.map((v) => v[0]);
});
onMounted(() => {
  let chart = proxy.$echarts.init(myChart.value);

  let Xadtas = ["2017-10-24", "2017-10-25", "2017-10-26", "2017-10-27"];

  let opts = {
    xAxis: { data: Xadtas },
    tooltip: {
      axisPointer: {
        type: "cross",
      },
    },
    yAxis: {},
    series: [
      {
        type: "candlestick",
        data: data.value,
        itemStyle: {
          color: "#ec5566", //上涨颜色
          color0: "pink", //下跌的颜色
          borderColor: "#8a0000",
          borderColor0: "#008f28",
        },
        markPoint: {
          data: [
            {
              type: "max",
              name: "最大值",
              valueDim: "highest", //在哪个维度上进行最大值和最小值设置
            },
            {
              type: "min",
              name: "最小值",
              valueDim: "highest", //在哪个维度上进行最大值和最小值设置
            },
            {
              type: "average",
              name: "平均值",
              valueDim: "highest", //在哪个维度上进行最大值和最小值设置
            },
          ],
        },
      },
      {
        type: "line",
        smooth: true,
        data: klinedata.value,
      },
    ],
  };
  chart.setOption(opts);
});
</script>

<style lang="scss" scoped>
.box {
  width: 500px;
  height: 520px;
  border: 1px solid #00ccff;
}
</style>
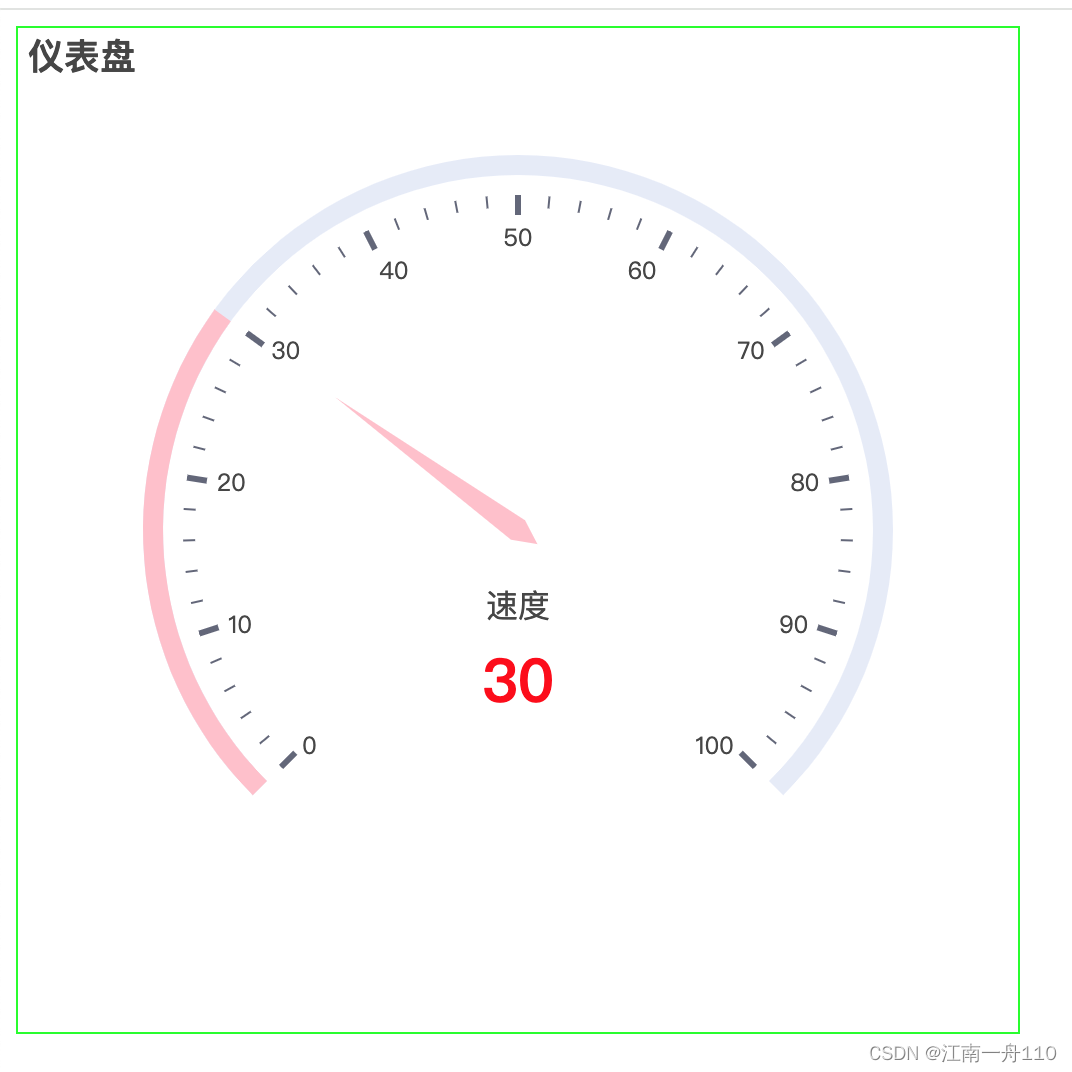
7.仪表盘
<template>
  <div ref="chart" class="box"></div>
</template>

<script setup>
import { getCurrentInstance, ref, onMounted } from "vue";

const { proxy } = getCurrentInstance();

const chart = ref();
onMounted(() => {
  let myChart = proxy.$echarts.init(chart.value);

  let opts = {
    title: {
      text: "仪表盘",
    },
    series: [
      {
        type: "gauge",
        progress: {
          show: true,
        },
        itemStyle: {
          color: "pink",
        },

        detail: {
          valueAnimation: true,
          formatter: "{value}",
          color: "red",
        },
        data: [
          {
            value: 30,
            name: "速度",
          },
        ],
      },
    ],
  };

  myChart.setOption(opts);
});
</script>

<style lang="scss" scoped>
.box {
  width: 500px;
  height: 502px;
  border: 1px solid #00ff00;
}
</style>
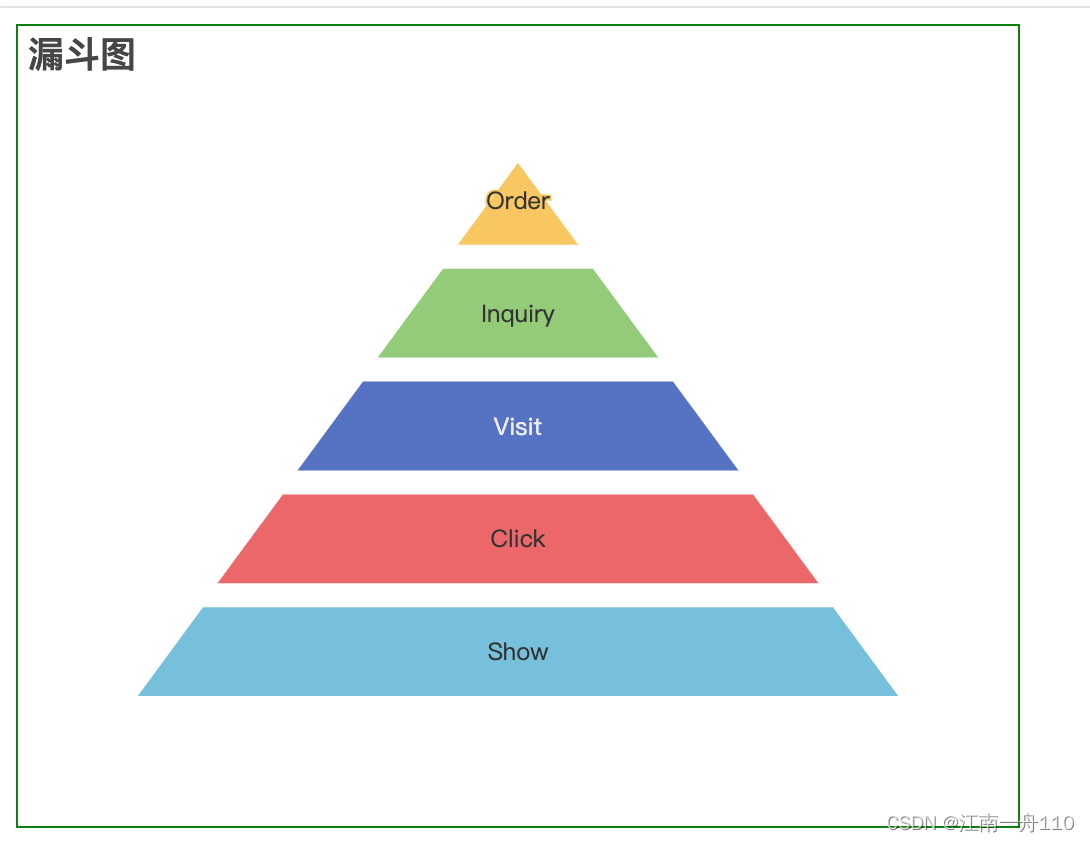
8.漏斗图
<template>
  <div ref="chart" class="box"></div>
</template>

<script setup>
import { ref, getCurrentInstance, onMounted } from "vue";

const { proxy } = getCurrentInstance();

const chart = ref();

onMounted(() => {
  let myChart = proxy.$echarts.init(chart.value);

  const opts = {
    title: {
      text: "漏斗图",
    },
    series: [
      {
        name: "Funnel",
        type: "funnel",
        left: "10%",
        top: 60,
        bottom: 60,
        width: "80%",
        min: 0,
        max: 100,
        minSize: "0%",
        maxSize: "100%",
        // sort: "descending", //降序
        sort: "ascending", //升序
        gap: 2,
        label: {
          show: true,
          position: "inside",
        },
        labelLine: {
          length: 10,
          lineStyle: {
            width: 1,
            type: "solid",
          },
        },
        itemStyle: {
          borderColor: "#fff",
          borderWidth: 10,
        },
        emphasis: {
          label: {
            fontSize: 20,
            color: "green",
          },
        },
        data: [
          { value: 60, name: "Visit" },
          { value: 40, name: "Inquiry" },
          { value: 20, name: "Order" },
          { value: 80, name: "Click" },
          { value: 100, name: "Show" },
        ],
      },
    ],
  };

  myChart.setOption(opts);
});
</script>

<style lang="scss" scoped>
.box {
  width: 500px;
  height: 400px;
  border: 1px solid green;
}
</style>
9.中国地图 地图资源下载添加链接描述
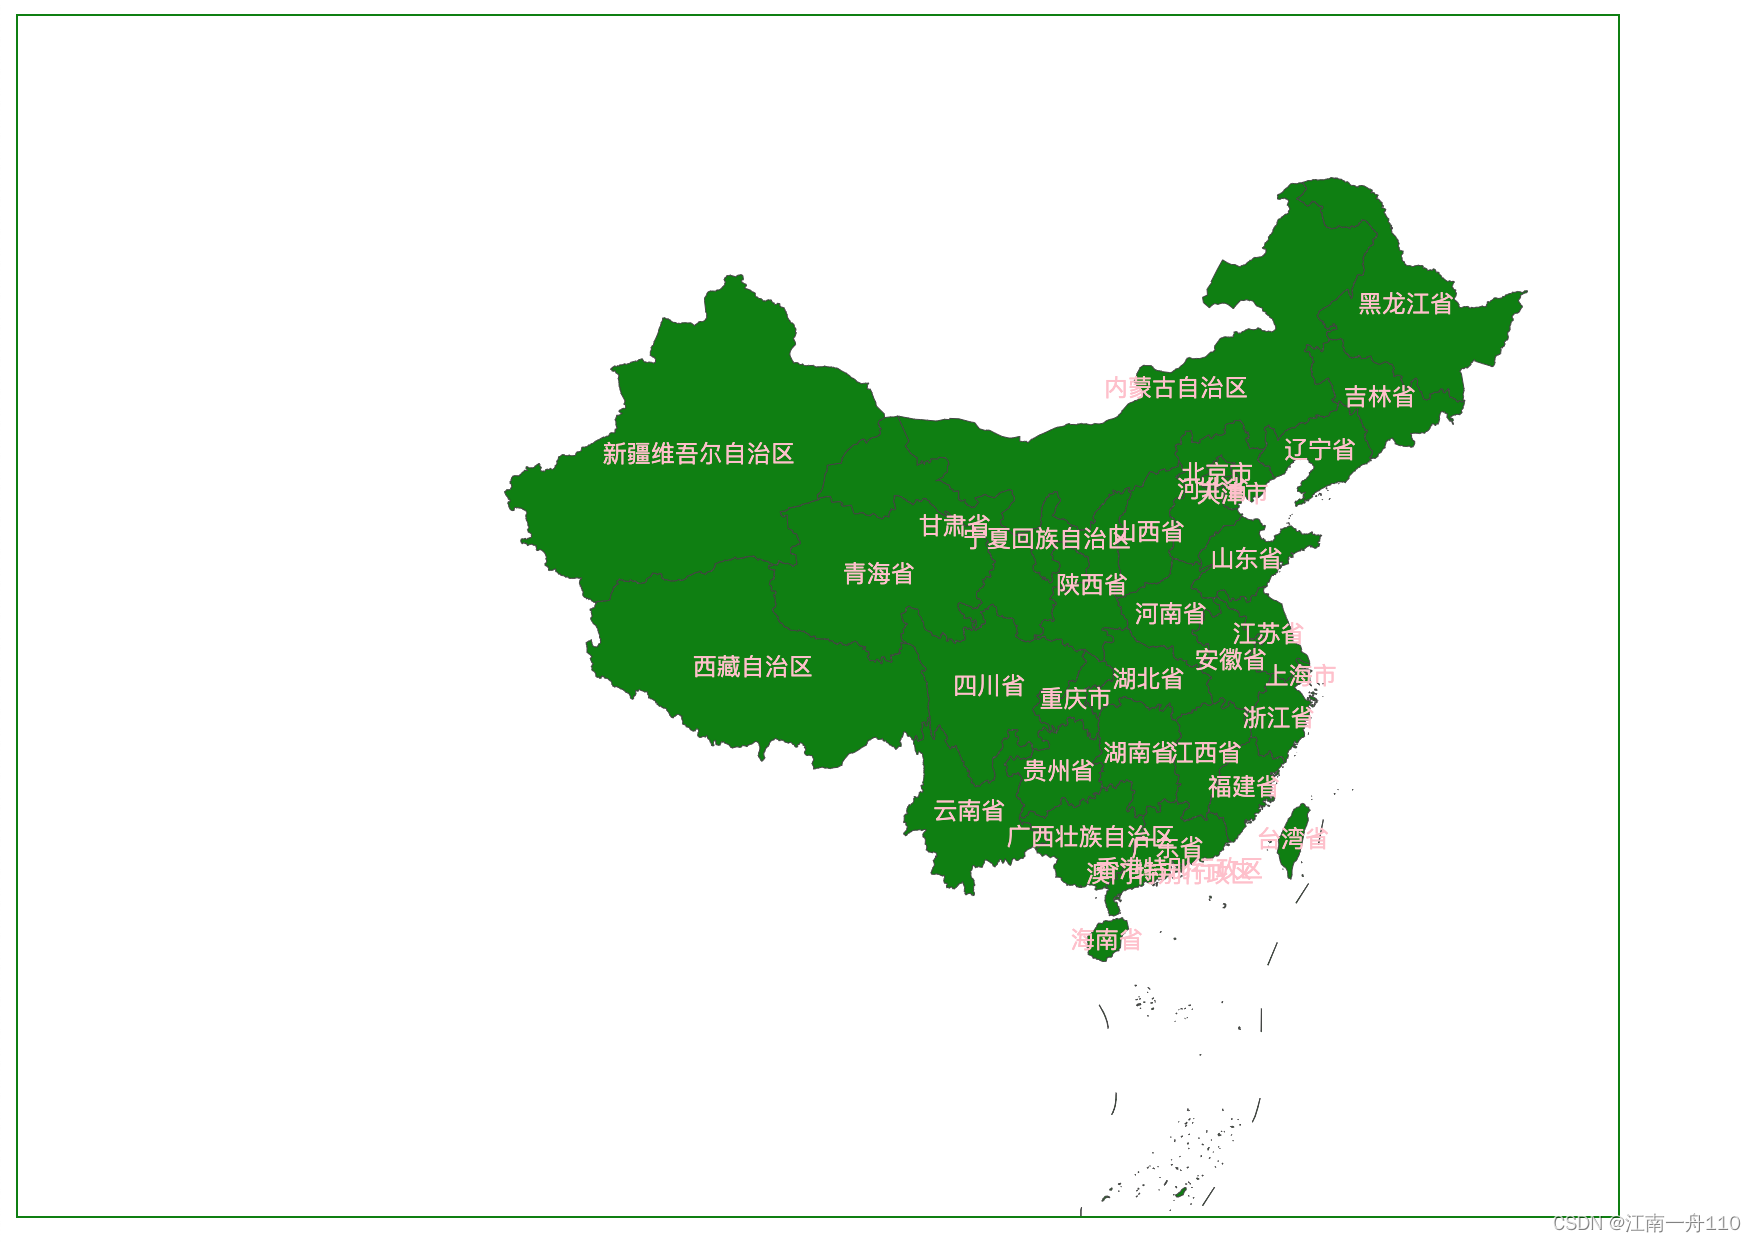
<template>
  <div ref="chart" class="box"></div>
</template>

<script setup>
import { ref, getCurrentInstance, onMounted } from "vue";
const { proxy } = getCurrentInstance();

import { mapData } from "../assets/mapdata";

import { xyData } from "@/assets/xydata";

const chart = ref();
onMounted(() => {
  let myChart = proxy.$echarts.init(chart.value);

  //地图JSON下载地址

  //注册地图名
  proxy.$echarts.registerMap("chinaMap", mapData);
  //   proxy.$echarts.registerMap("xyang", xyData);

  let opts = {
    geo: {
      //地理坐标组件
      type: "map",
      map: "chinaMap",
      roam: true, //平移和缩放
      label: {
        show: true,
        color: "pink",
        fontSize: 12,
      },
      itemStyle: {
        areaColor: "green",
      },
      zoom: 2, //缩放比例

      //坐标拾取器,中心点

      //   center: [],
    },
  };

  myChart.setOption(opts);
});
</script>

<style lang="scss" scoped>
.box {
  width: 800px;
  height: 600px;
  border: 1px solid green;
}
</style>
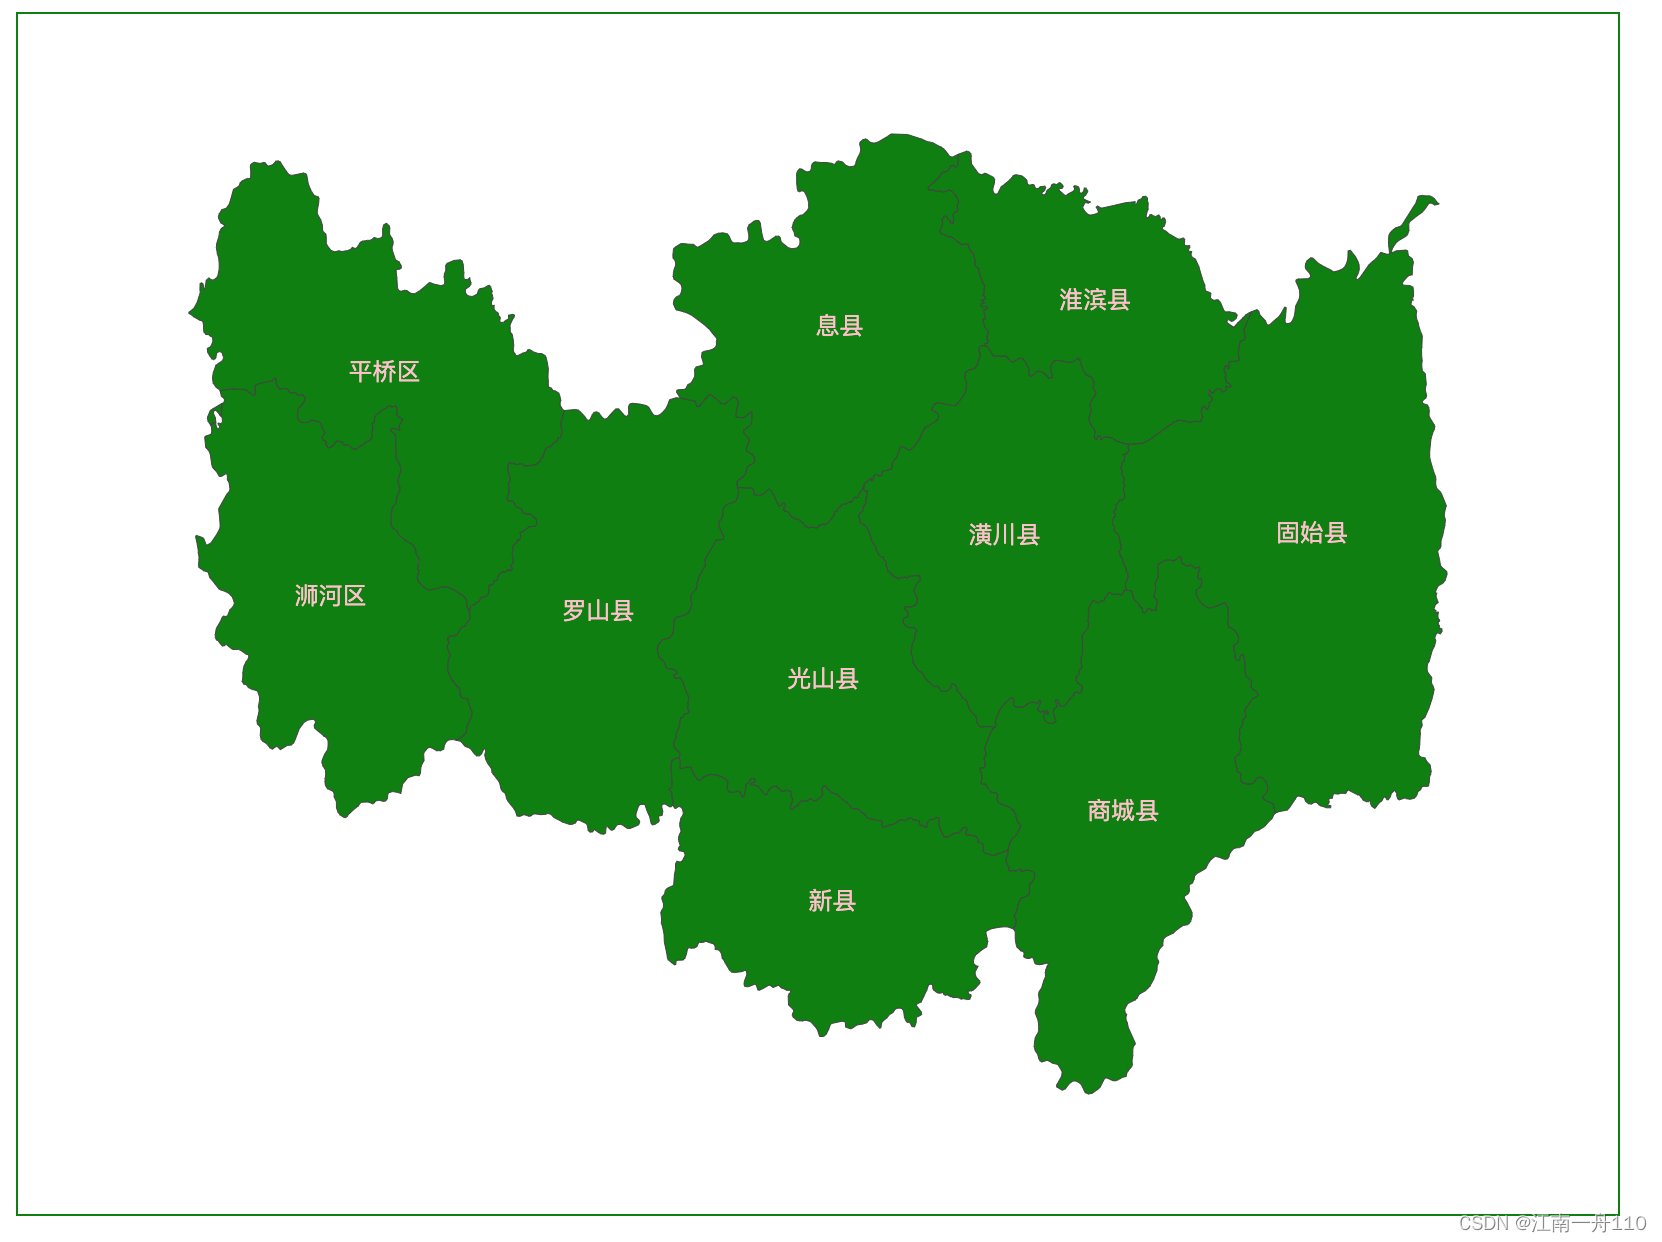
10、市区地图 地图资源下载
<template>
  <div ref="chart" class="box"></div>
</template>

<script setup>
import { ref, getCurrentInstance, onMounted } from "vue";
const { proxy } = getCurrentInstance();

import { mapData } from "../assets/mapdata";

import { xyData } from "@/assets/xydata";

const chart = ref();
onMounted(() => {
  let myChart = proxy.$echarts.init(chart.value);

  //地图JSON下载地址

  //注册地图名
  //   proxy.$echarts.registerMap("chinaMap", mapData);
  proxy.$echarts.registerMap("xyang", xyData);

  let opts = {
    geo: {
      //地理坐标组件
      type: "map",
      map: "xyang",
      roam: true, //平移和缩放
      label: {
        show: true,
        color: "pink",
        fontSize: 12,
      },
      itemStyle: {
        areaColor: "green",
      },
      //   zoom: 2, //缩放比例

      //坐标拾取器,中心点

      //   center: [],
    },
  };

  myChart.setOption(opts);
});
</script>

<style lang="scss" scoped>
.box {
  width: 800px;
  height: 600px;
  border: 1px solid green;
}
</style>
文章来源:https://blog.csdn.net/qq_30519365/article/details/135438971
本文来自互联网用户投稿,该文观点仅代表作者本人,不代表本站立场。本站仅提供信息存储空间服务,不拥有所有权,不承担相关法律责任。 如若内容造成侵权/违法违规/事实不符,请联系我的编程经验分享网邮箱:chenni525@qq.com进行投诉反馈,一经查实,立即删除!
本文来自互联网用户投稿,该文观点仅代表作者本人,不代表本站立场。本站仅提供信息存储空间服务,不拥有所有权,不承担相关法律责任。 如若内容造成侵权/违法违规/事实不符,请联系我的编程经验分享网邮箱:chenni525@qq.com进行投诉反馈,一经查实,立即删除!
