python dash3股票的模拟3
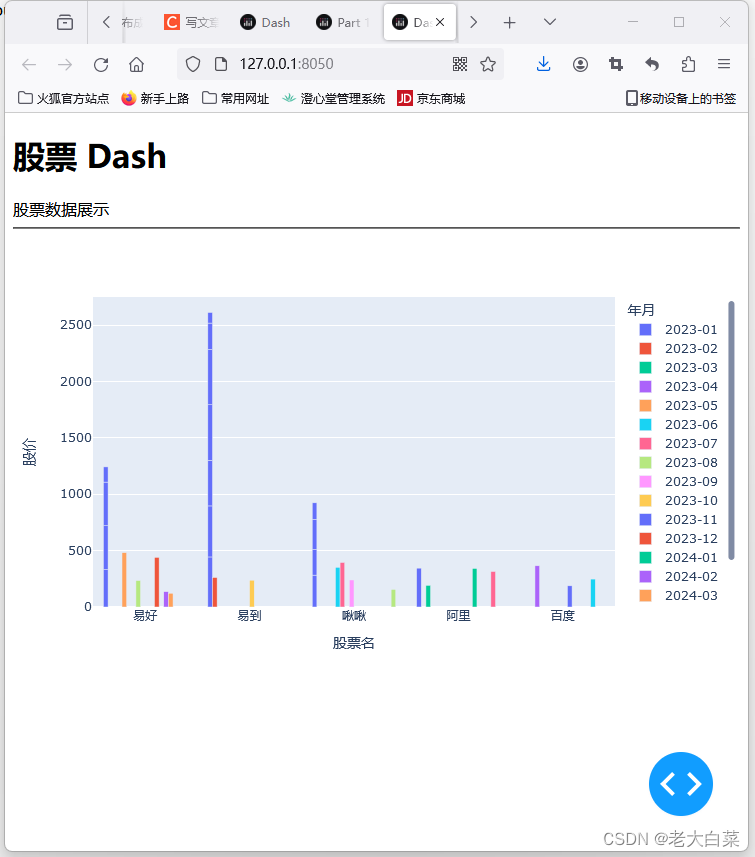
效果:

代码:
dash:Dash 主模块,用于创建 Dash 应用。通过导入 dash,你可以定义应用的外观和行为。
from dash import Dash
app = Dash(__name__)
dash_core_components:包含用于创建核心组件(如图表、表格、输入框等)的 Dash 组件。这些组件是用户界面的构建块。
import dash_core_components as dcc
dash_html_components:包含用于创建 HTML 元素(如标题、段落、列表等)的 Dash 组件。这些组件用于定义应用的布局。
import dash_html_components as html
dash.dependencies:用于定义 Dash 应用的交互性。可以使用 Input 和 Output 来声明组件之间的依赖关系,并使用回调函数实现交互逻辑。
from dash.dependencies import Input, Output
dash.exceptions:包含 Dash 应用可能引发的异常类。例如,PreventUpdate 异常可用于在回调函数中提前结束回调而不更新页面。
from dash.exceptions import PreventUpdate
dash.testing:提供用于测试 Dash 应用的工具。可以使用这个模块来编写测试用例,确保应用在不同条件下的正确运行。
import dash.testing
dash.callback_context:用于在回调函数中访问上下文信息。可以使用这个模块获取回调的触发组件、触发属性等信息。
from dash import callback_context
这些模块一起构成了 Dash 框架的基础,允许用户以声明式方式构建交互式 web 应用程序。你可以通过结合使用这些模块来创建动态和可视化丰富的数据应用。
app.layout 这里做了一个layout然所将内容渲染出来。
dcc.Interval(
id=‘interval-component’,
interval=10 * 1000, # in milliseconds (refresh every 10 seconds)
n_intervals=0
)这里进行定时任务。
@app.callback(Output(‘Stock-graph’, ‘figure’),
[Input(‘interval-component’, ‘n_intervals’)]) 进行刷新数据,它的意思是:“当 ‘interval-component’ 的 n_intervals 属性发生变化时,执行这个回调函数,并将更新后的图表作为输出,更新 ‘Stock-graph’ 组件的 ‘figure’ 属性。”
@app.callback 是 Python 中的装饰器,用于定义一个回调函数。回调函数指定了一个或多个输入(Input)以及一个或多个输出(Output)。
Output('Stock-graph', 'figure') 指定了这个回调函数的输出。具体来说,这里指定了一个名为 'Stock-graph' 的 Dash 组件(图表),输出的属性是 'figure'。这表示回调函数将更新这个图表的图形。

[Input('interval-component', 'n_intervals')] 指定了回调函数的输入。在这里,它指定了一个名为 'interval-component' 的 Dash 组件,该组件的属性是 'n_intervals'。这是一个 dcc.Interval 组件,用于定期触发回调函数。n_intervals 表示自应用启动以来,这个组件被触发的次数。通过监视 n_intervals,你可以实现定期更新或轮询的效果。
from dash import Dash, html, dcc, callback, Output, Input
import plotly.express as px
import pandas as pd
from datetime import datetime, timedelta
import random
# 创建 Dash 应用
app = Dash(__name__)
# 创建示例数据框
stocks = ["阿里", "啾啾", "易好", "易到", "百度"]
start_date = datetime(2023, 1, 1)
end_date = datetime(2023, 5, 1)  # Extend the end date for demonstration purposes
# Generate initial data
data = {
    "股票名": random.choices(stocks, k=16),
    "股价": [random.uniform(100, 500) for _ in range(16)],
    "年月": [(start_date + timedelta(days=i)).strftime("%Y-%m") for i in range(16)]
}
df = pd.DataFrame(data)
# 输出数组长度
print(len(df["股票名"]), len(df["股价"]), len(df["年月"]))
# 使用 Plotly Express 创建柱状图
fig = px.bar(df, x="股票名", y="股价", color="年月", barmode="group")
# 定义 Dash 应用的布局
app.layout = html.Div(children=[
    html.H1(children='股票 Dash'),  # 页面标题
    html.Div(children='''
        股票数据展示
    '''),  # 页面文本
    html.Hr(),  # 水平线
    dcc.Graph(
        id='Stock-graph',
        figure=fig
    ),  # 图表
    dcc.Interval(
        id='interval-component',
        interval=10 * 1000,  # in milliseconds (refresh every 10 seconds)
        n_intervals=0
    )
])
# 装饰符 在我理解定义关系 好象springboot里的@ 减少代码量。php中用的是注解解决。C#用的是[]
@app.callback(Output('Stock-graph', 'figure'),
              [Input('interval-component', 'n_intervals')])
def update_graph(n):
    # Find the current maximum date in the dataframe
    max_date = pd.to_datetime(df['年月']).max()
    # Increment the maximum date by one month
    new_date = max_date + pd.DateOffset(months=1)
    # Update the data with a new row for the new month
    new_row = {
        "股票名": random.choice(stocks),
        "股价": random.uniform(100, 500),
        "年月": new_date.strftime("%Y-%m")
    }
    df.loc[len(df)] = new_row
    # Randomly vary the stock prices, ensuring it's capped at 500
    df['股价'] = [min(price + random.uniform(-10, 10), 500) for price in df['股价']]
    # Update the figure
    updated_fig = px.bar(df, x="股票名", y="股价", color="年月", barmode="group")
    return updated_fig
# 运行应用
if __name__ == '__main__':
    app.run(debug=True)
本文来自互联网用户投稿,该文观点仅代表作者本人,不代表本站立场。本站仅提供信息存储空间服务,不拥有所有权,不承担相关法律责任。 如若内容造成侵权/违法违规/事实不符,请联系我的编程经验分享网邮箱:chenni525@qq.com进行投诉反馈,一经查实,立即删除!
- Python教程
- 深入理解 MySQL 中的 HAVING 关键字和聚合函数
- Qt之QChar编码(1)
- MyBatis入门基础篇
- 用Python脚本实现FFmpeg批量转换
- uniapp计算视频学习进程,并且下次回来继续播放(不能快进)
- 网络安全中级进阶试题
- 月入10.5K,专科小伙转行网优:据说每个领域都有一个“显眼包”
- 北京交通大学高性能作业——CPU SIMD + GPU SIMD
- 2023下半年的总结
- 【高性能篇】QPS概念、RT概念
- 图神经网络 (GNN) 概述
- WEB:探索开源OFD.js技术应用
- 【数据结构——图】图的遍历(头歌习题)【合集】
- DNF86 怀旧 经典 超有趣版本