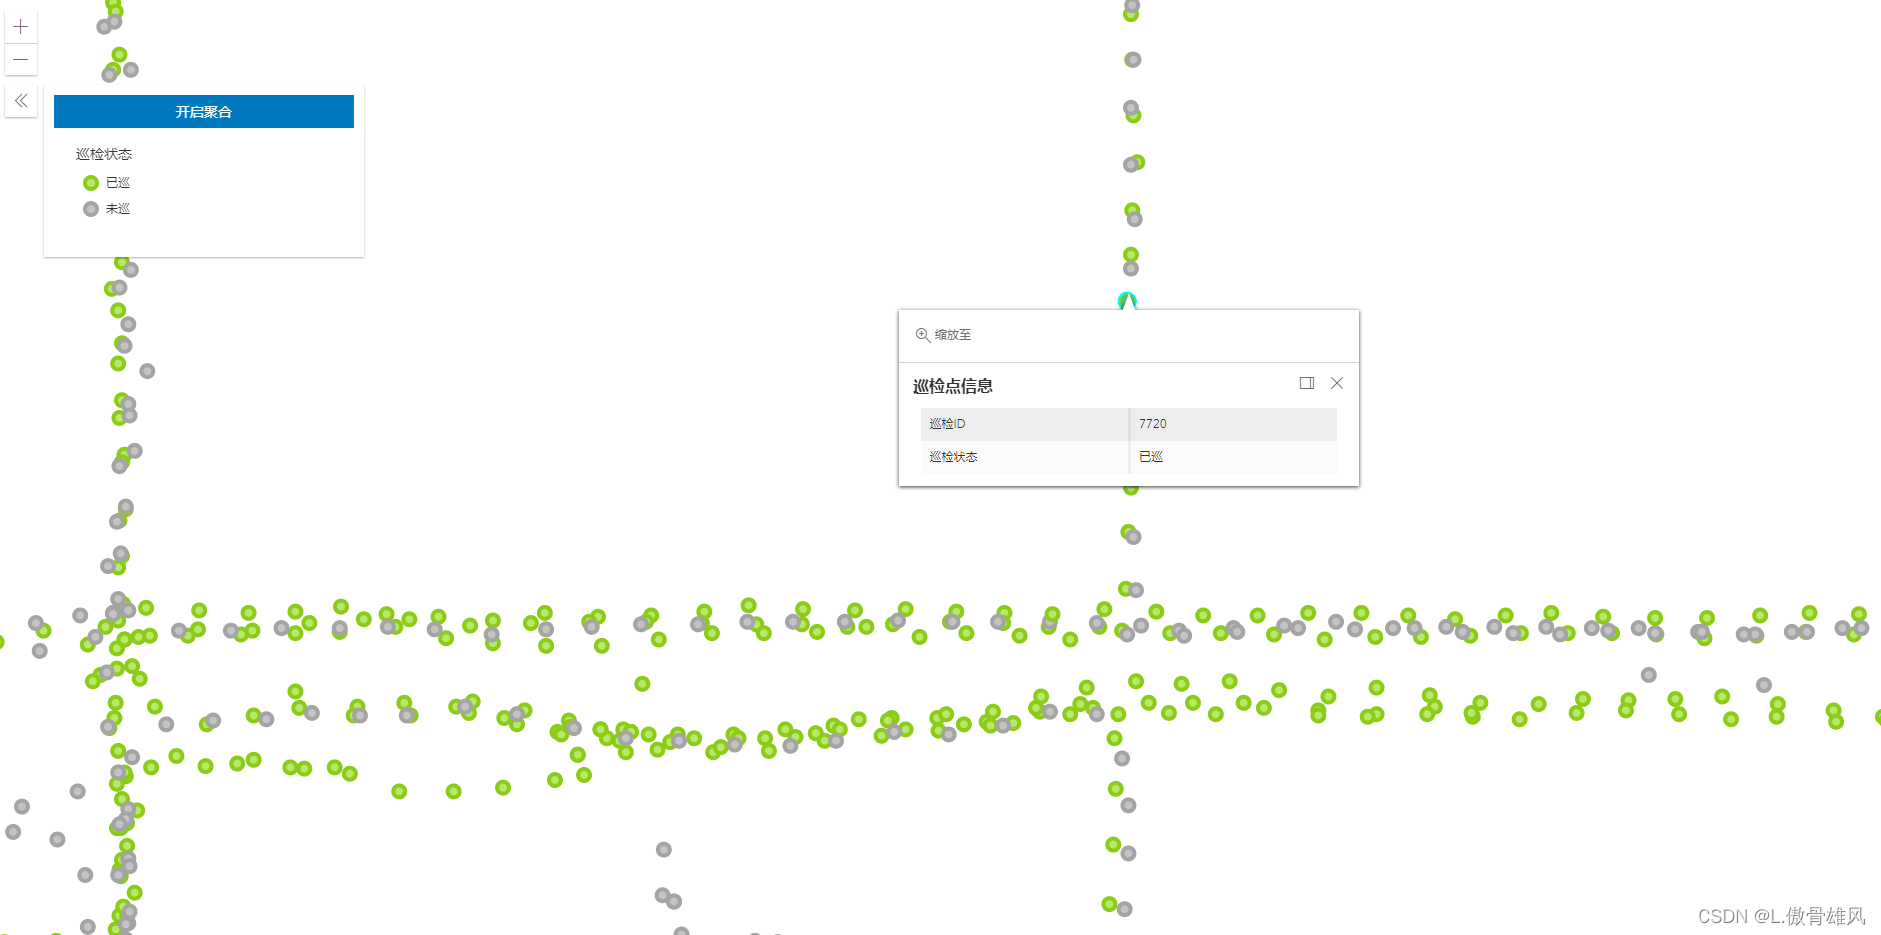
基于arcgis js api 4.x开发点聚合效果
发布时间:2024年01月18日
一、代码
?
<html>
<head>
<meta charset="utf-8" />
<meta name="viewport"
content="initial-scale=1,maximum-scale=1,user-scalable=no" />
<title>
Build a custom layer view using deck.gl | Sample | ArcGIS API for
JavaScript 4.23
</title>
<link rel="stylesheet" href="http://localhost/arcgis_js_api_424/4.24/esri/css/main.css" />
<script src="http://localhost/arcgis_js_api_424/4.24/init.js"></script>
<style>
html,
body,
#viewDiv {
padding: 0;
margin: 0;
height: 100%;
width: 100%;
}
#infoDiv {
padding: 10px;
}
</style>
<script>
require(["esri/Map", "esri/views/MapView", "esri/Graphic", "esri/layers/GraphicsLayer",
"esri/widgets/Editor",
"esri/layers/TileLayer", "esri/layers/WMTSLayer", "esri/layers/WebTileLayer",
"esri/geometry/Extent", "esri/geometry/Point",
"esri/widgets/Sketch/SketchViewModel",
"esri/layers/FeatureLayer", "esri/geometry/SpatialReference",
"esri/symbols/SimpleFillSymbol", "esri/geometry/Polygon", "esri/symbols/SimpleMarkerSymbol",
"esri/symbols/SimpleLineSymbol",
"esri/renderers/HeatmapRenderer", "esri/renderers/UniqueValueRenderer", "esri/Color",
"esri/layers/support/LabelClass", "esri/widgets/Legend", "esri/widgets/Expand",
], (
Map,
MapView, Graphic, GraphicsLayer, Editor,
TileLayer, WMTSLayer, WebTileLayer, Extent, Point, SketchViewModel,
FeatureLayer, SpatialReference, SimpleFillSymbol, Polygon, SimpleMarkerSymbol,
SimpleLineSymbol, HeatmapRenderer,
UniqueValueRenderer, Color, LabelClass, Legend, Expand
) => {
$.ajax({
url: "./data/point.json",
type: "get",
dataType: "json",
success: function (data) {
map = new Map({
// basemap: "streets-vector"
});
console.log(data)
const view = new MapView({
container: "viewDiv",
map: map,
// center: [113.55, 34.78],
//zoom:12,
spspatialReference: {
wkid: 4547
},
extent: new Extent({
xmin: 344577.88,
ymin: 2380651.49,
xmax: 655422.12,
ymax: 5036050.38,
spatialReference: new SpatialReference({ wkid: 4547 })
})
});
var features = data.features;
let symbol = {
type: "simple-marker", // autocasts as new SimpleMarkerSymbol()
style: "square",
color: "blue",
size: "18px",
outline: { // autocasts as new SimpleLineSymbol()
color: [255, 255, 0],
width: 3 // points
}
};
var graphicList = [];
for (var i = 0; i < 50000; i++) {
var feature = features[i];
if (i < 30000) {
graphicList.push(new Graphic({
geometry: new Point({
x: feature.geometry.coordinates[0],
y: feature.geometry.coordinates[1],
spatialReference: {
wkid: 4547
}
}),
symbol: symbol,
attributes: { "ObjectID": i + 1, "PatrolStatus": "已巡","Rate":1.0 }
}));
}
if (i >= 30000) {
graphicList.push(new Graphic({
geometry: new Point({
x: feature.geometry.coordinates[0],
y: feature.geometry.coordinates[1],
spatialReference: {
wkid: 4547
}
}),
symbol: symbol,
attributes: { "ObjectID": i + 1, "PatrolStatus": "未巡", "Rate": 0.0 }
}))
};
}
var renderer = {
type: "unique-value",
field: "PatrolStatus",
defaultSymbol: null,
uniqueValueInfos: [{
value: "已巡",
symbol: {
type: "simple-marker",
style: "circle",
color: "rgb(182,232,105)",
size: "12px",
outline: {
color: "rgb(140,203,23)",
width: "4px",
}
}
}, {
value: "未巡",
symbol: {
type: "simple-marker",
style: "circle",
color: "rgb(195,195,195)",
size: "12px",
outline: {
color: "rgb(164,164,164)",
width: "4px",
}
}
}]
}
const clusterConfig = {
type: "cluster",
clusterRadius: 40,
maxScale: 5000,
popupTemplate: {
title: "巡检点聚类信息",
content: "此聚类表示 {cluster_count} 个巡检点",
fieldInfos: [{
fieldName: "cluster_count",
format: {
places: 0,
digitSeparator: true
}
}],
labelingInfo: [{
deconflictionStrategy: "none",
labelExpressionInfo: {
expression: "Text($feature.cluster_count, '#,###')"
},
symbol: {
type: "text",
color: "#004a5d",
font: {
weight: "bold",
family: "Noto Sans",
size: "12px"
}
},
labelPlacement: "center-center",
}],
//clusterMinSize: "24px",
//clusterMaxSize: "60px",
}
};
let featureLayer = new FeatureLayer({
fields: [
{
name: "ObjectID",
alias: "ObjectID",
type: "oid"
},
{
name: "PatrolStatus",
alias: "巡检状态",//用于图例上显示中文
type: "string"
},
{
name: "Rate",
alias: "Rate",
type: "double"
}
],
outFields: ["*"],
opacity: 1,
source: graphicList,
featureReduction: clusterConfig,
renderer: renderer,
popupTemplate: {
title: "巡检点信息",
content: [
{
type: "fields",
fieldInfos: [
{
fieldName: "ObjectID",
label: "巡检ID"
},
{
fieldName: "PatrolStatus",
label: "巡检状态"
},
]
}
]
}
});
map.add(featureLayer);
const legend = new Legend({
view: view,
container: "legendDiv"
});
const infoDiv = document.getElementById("infoDiv");
view.ui.add(new Expand({
view: view,
content: infoDiv,
expandIcon: "list-bullet",
expanded: false
}), "top-left");
const toggleButton = document.getElementById("cluster");
toggleButton.addEventListener("click", () => {
let fr = featureLayer.featureReduction;
featureLayer.featureReduction = fr && fr.type === "cluster" ? null : clusterConfig;
toggleButton.innerText = toggleButton.innerText === "开启聚合" ? "取消聚合" : "开启聚合";
});
}
})
});
</script>
</head>
<body>
<div id="viewDiv"></div>
<div id="infoDiv" class="esri-widget">
<button id="cluster" class="esri-button">取消聚合</button>
<div id="legendDiv"></div>
</div>
</body>
</html>
二、效果
1.开启聚合

2.取消聚合

文章来源:https://blog.csdn.net/xlp789/article/details/135666361
本文来自互联网用户投稿,该文观点仅代表作者本人,不代表本站立场。本站仅提供信息存储空间服务,不拥有所有权,不承担相关法律责任。 如若内容造成侵权/违法违规/事实不符,请联系我的编程经验分享网邮箱:chenni525@qq.com进行投诉反馈,一经查实,立即删除!
本文来自互联网用户投稿,该文观点仅代表作者本人,不代表本站立场。本站仅提供信息存储空间服务,不拥有所有权,不承担相关法律责任。 如若内容造成侵权/违法违规/事实不符,请联系我的编程经验分享网邮箱:chenni525@qq.com进行投诉反馈,一经查实,立即删除!
最新文章
- Python教程
- 深入理解 MySQL 中的 HAVING 关键字和聚合函数
- Qt之QChar编码(1)
- MyBatis入门基础篇
- 用Python脚本实现FFmpeg批量转换
- 基于SpringBoot的客户关系管理系统
- Gpt指引ubuntu安装java8/11
- 边缘计算网关:在智慧储能系统中做好储能通信管家
- ARO Robot Controller
- pytest实现多进程与多线程运行超好用的插件
- Linux ldd/ld/ldconfig命令
- 计算机组成原理-CPU数据通路(单总线结构和专用通路结构)
- Windows Sockets 2 笔记
- 微服务架构+服务注册中心+Nacos和Eureka+比较分析
- 基于Quartus Prime平台从新建工程开始以verilog HDL File保存为顶层文件并采用例化模块的设计方法,RTL Viewer、Sgnal Tap Logic Analyzer的使用