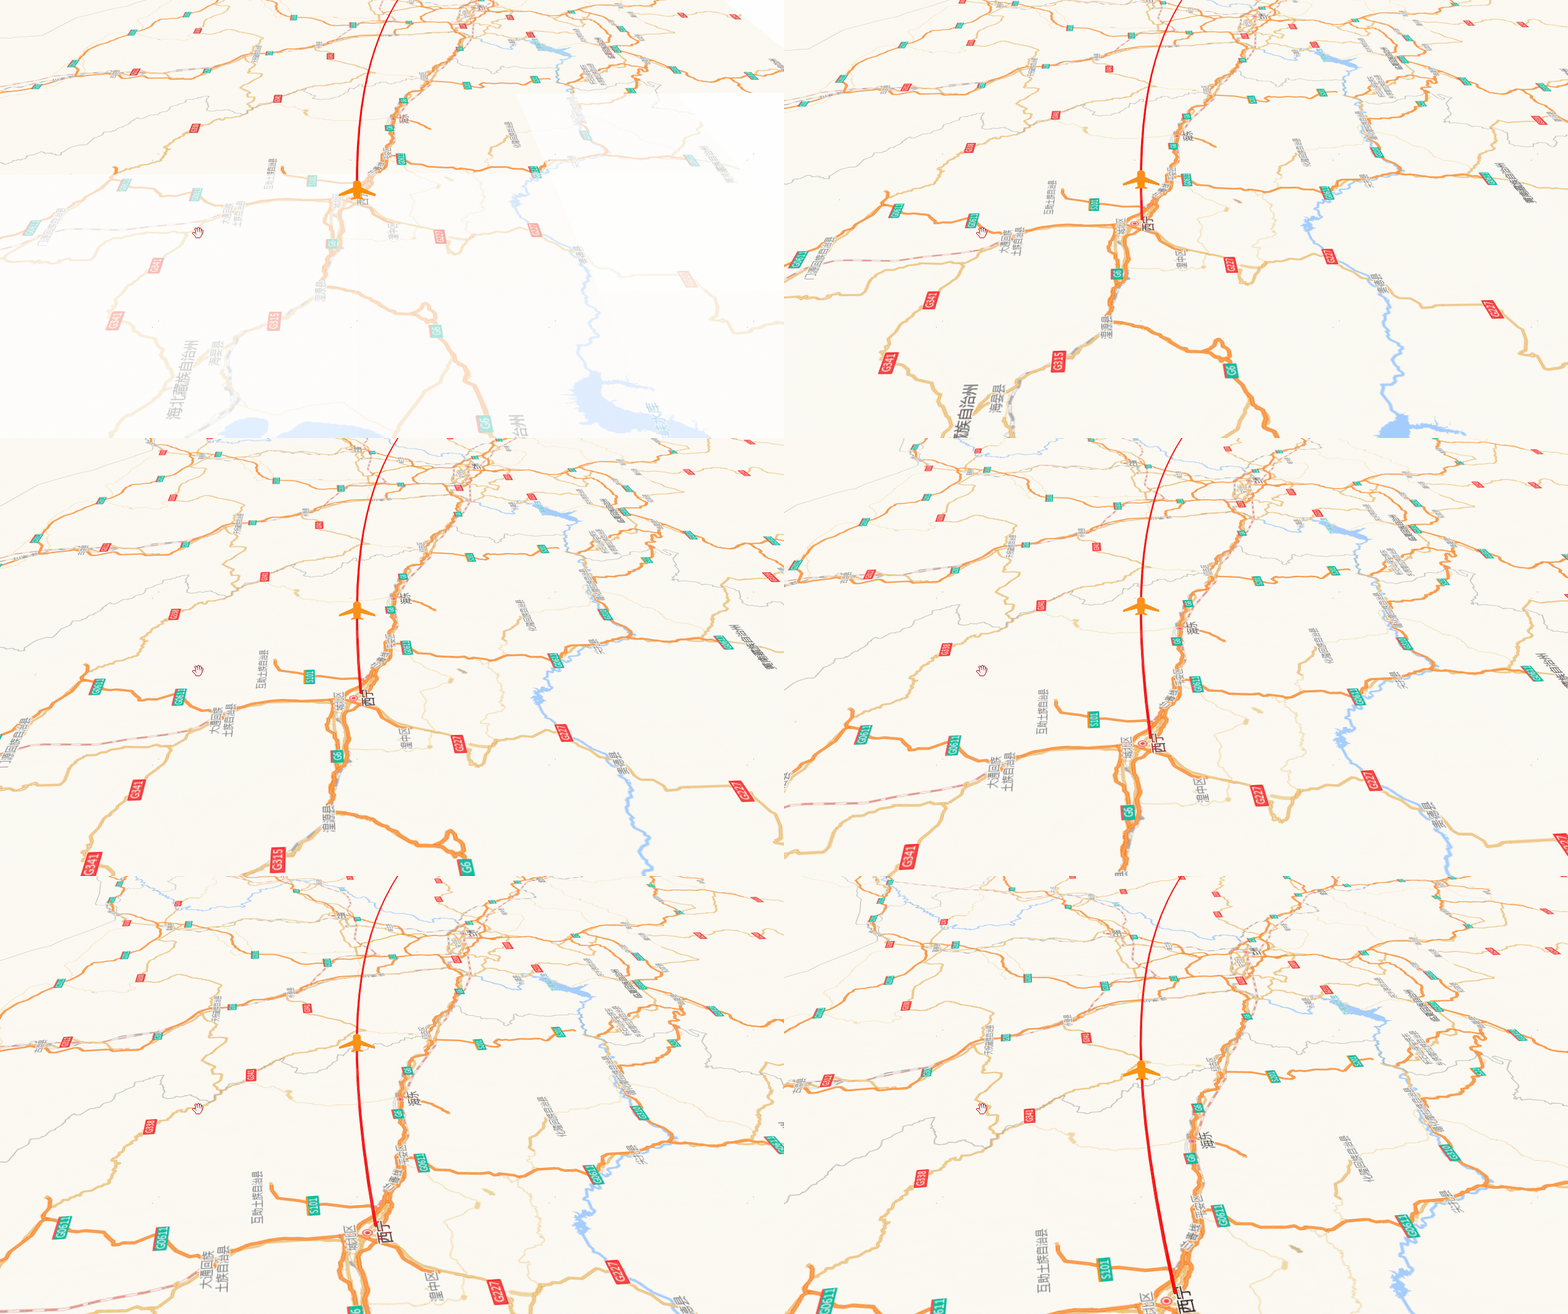
mapboxGL中的航线动画
发布时间:2024年01月21日
概述
借用上篇文章中二阶贝塞尔曲线的生成,本文实现mapboxGL中的航线动画。
效果

实现
1. 初始化地图
const from = [101.797439042302, 36.5937248286007];
const to = [106.9733, 35.217];
const points = new ArcLine(from, to);
const line = new Geometry(points, "LineString")

const style = {
  version: 8,
  sources: {
    XYZTile: {
      type: "raster",
      tiles: [
        "http://webrd01.is.autonavi.com/appmaptile?x={x}&y={y}&z={z}&lang=zh_cn&size=1&scale=1&style=8",
        "http://webrd02.is.autonavi.com/appmaptile?x={x}&y={y}&z={z}&lang=zh_cn&size=1&scale=1&style=8",
        "http://webrd03.is.autonavi.com/appmaptile?x={x}&y={y}&z={z}&lang=zh_cn&size=1&scale=1&style=8",
        "http://webrd04.is.autonavi.com/appmaptile?x={x}&y={y}&z={z}&lang=zh_cn&size=1&scale=1&style=8",
      ],
      tileSize: 256,
    },
    LineVector: {
      type: "geojson",
      data: line,
    },
  },
  layers: [
    {
      id: "XYZTile",
      type: "raster",
      source: "XYZTile",
      minzoom: 0,
      maxzoom: 22,
    },
    {
      id: "LineVector",
      type: "line",
      source: "LineVector",
      paint: {
        "line-color": "#f00",
        "line-width": 3,
      },
    },
  ],
};

const map = new mapboxgl.Map({
  container: "map",
  style,
  attributionControl: false,
  center: [104.74329766269716, 35.80025022526921],
  zoom: 8,
  pitch: 60,
  bearing: getAngle(from, to)
});
2. 添加飞机
map.on('load', () => {
  // 添加动态图标
  map.loadImage('../css/icon.png', function(error, image) {
    if (error) throw error
    map.addImage('flyline-icon', image)
    map.addSource('flyline-point', {
      'type': 'geojson',
      'data': new Geometry(from, 'Point')
    })
    map.addLayer({
      'id': 'flyline-point',
      'source': 'flyline-point',
      'type': 'symbol',
      'layout': {
        'icon-image': 'flyline-icon',
        'icon-size': 0.4,
        'icon-allow-overlap': true,
        'icon-rotation-alignment': 'map',
        'icon-pitch-alignment': 'map',
        'icon-rotate': 0
      }
    })
})
3. 开始动画
const count = 500
const length = turf.length(line)
const interval = length / count
let index = 0
let playFunction = () => {
  if(index > count) {
    clearInterval(playFlag)
  } else {
    const point = turf.along(line, index * interval)
    const pointP = turf.along(line, index * interval * 0.8)
    map.getSource('flyline-point').setData(point)
    const rotate = getAngle(pointP.geometry.coordinates, point.geometry.coordinates)
    map.setLayoutProperty('flyline-point', 'icon-rotate', rotate)
    setView(pointP.geometry.coordinates, rotate + 90)
    index++
  }
}
let playFlag = setInterval(playFunction)
playFunction()

/ / 设置视图
function setView(center, angle) {
  map.setBearing(angle);
  map.setCenter(center);
}

// 计算角度
function getAngle(coords1, coords2) {
  return turf.bearing(
    turf.point(coords1),
    turf.point(coords2)
  ) - 90
}
文章来源:https://blog.csdn.net/GISShiXiSheng/article/details/135726043
本文来自互联网用户投稿,该文观点仅代表作者本人,不代表本站立场。本站仅提供信息存储空间服务,不拥有所有权,不承担相关法律责任。 如若内容造成侵权/违法违规/事实不符,请联系我的编程经验分享网邮箱:chenni525@qq.com进行投诉反馈,一经查实,立即删除!
本文来自互联网用户投稿,该文观点仅代表作者本人,不代表本站立场。本站仅提供信息存储空间服务,不拥有所有权,不承担相关法律责任。 如若内容造成侵权/违法违规/事实不符,请联系我的编程经验分享网邮箱:chenni525@qq.com进行投诉反馈,一经查实,立即删除!
最新文章
- Python教程
- 深入理解 MySQL 中的 HAVING 关键字和聚合函数
- Qt之QChar编码(1)
- MyBatis入门基础篇
- 用Python脚本实现FFmpeg批量转换
- 【Vue新手必看】ElementUI表单实战教程,轻松掌握!
- 9. 乐观锁
- 纯html写个个人简历!模版分享啦!!!
- 【Java 设计模式】结构型之桥接模式
- electron + sqlite3 解决打包后无法写入数据库
- python——解决实际应用题
- C#,入门教程(02)—— Visual Studio 2022开发环境搭建图文教程
- 小程序基础学习(登录)(重点核心)
- 【大气】大气吸收损耗模型【含Matlab源码 2888期】
- Spark四:Spark Streaming和Structured Streaming