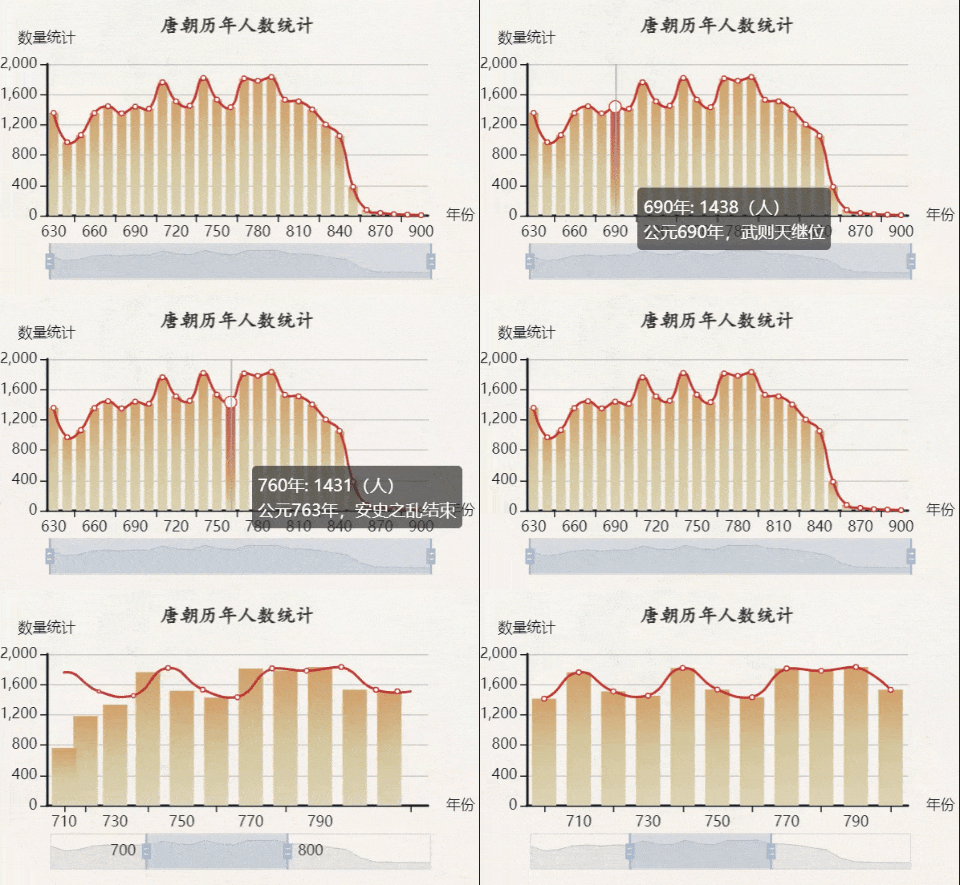
可视化 | 【echarts】渐变条形+折线复合图
发布时间:2024年01月20日

📚html + css
- html:在这主要是用于整合,将html、css、js连接在一块,虽然单个模板代码量不大,但还是先分开,之后模板运用更自如。
<!DOCTYPE html> <html lang="en"> <head> <meta charset="UTF-8"> <meta name="viewport" content="width=device-width, initial-scale=1.0"> <title>可视化模板一</title> <link rel="stylesheet" href="./style.css"> </head> <body> <div id="test1"></div> </body> <!-- echarts引入 --> <script src="https://cdn.staticfile.org/echarts/4.3.0/echarts.min.js"></script> <script src="./script.js"></script> </html> - css:这里的css主要实现了以下几个效果:
- ①加了一个浅浅的背景色
- ②将图标框水平垂直居中
- ③以视口大小为准作60%缩放
body{
    background-color: #f5f2e9;
}
#test1 {
    position: absolute;
    top: 50%;
    left: 50%;
    transform: translate(-50%, -50%);
    height: 60vh;
    width: 60vw;
}
📚js
🐇总体框架
- 使用
echarts.init方法初始化了一个 ECharts 实例,指定了一个 div 元素作为图表的容器。 - 定义图表的配置项
option,其中包括了图表的标题、提示框、x 轴、y 轴、数据系列以及数据缩放功能等等。 - 通过
myChart.resize将配置项应用到echarts实例。 - 绑定事件处理函数
myChart.resize以便让图表自适应新的窗口大小,确保图表在不同尺寸的屏幕上能够正确显示。// 基于准备好的dom,初始化echarts实例 var myChart = echarts.init(document.getElementById('test1')); // 指定图表的配置项和数据 var option = {}; // 使用刚指定的配置项和数据显示图表。 if (option && typeof option === 'object') { myChart.setOption(option); } //让图表自适应新的窗口大小 window.addEventListener('resize', myChart.resize);
🐇option配置项
- 标题
text: '唐朝历年人数统计':指定了标题的文本内容为“唐朝历年人数统计”。left: 'center':将标题水平居中显示。top: '6%':指定了标题距离容器顶部的距离为容器高度的 6% 处。这里使用百分比是为了相对于容器的高度来设定距离,而不是使用固定的像素值。textStyle:用于设置标题的文本样式。其中包含了以下几个属性:color: '#333':指定了标题文本的颜色为深灰色。fontSize: 24:设置了标题文本的字号为 24 像素。fontWeight: 'bold':将标题文本设置为粗体显示。fontFamily: 'KaiTi, serif':指定了标题文本的字体为楷体(KaiTi),如果设备不支持楷体,则会回退到默认的衬线字体。
title: { text: '唐朝历年人数统计', left: 'center', top: '6%', textStyle: { color: '#333', fontSize: 24, fontWeight: 'bold', fontFamily: 'KaiTi, serif' } } - 鼠标悬浮提示框
trigger: 'axis':指定了触发类型为坐标轴触发,即在鼠标指向坐标轴时触发提示。formatter: function (params) { ... }:定义了一个回调函数,用于自定义提示框内容的格式。- 通过判断 params[0].dataIndex 的值,根据不同的年份数据索引来返回不同的提示信息:如果 dataIndex 等于 2,表示年份为 650 年,返回的提示包含了人数和一些相关事件的信息。 类似地,针对其他特定的年份,返回相应的提示信息,例如 690 年、712 年、755 年等。
- 对于其他年份,则默认返回格式为“年份: 人数(人)”的提示信息。
tooltip: { trigger:'axis', formatter: function (params) { if (params[0].dataIndex === 2) { // Check for the year 650 return params[0].name + '年: ' + params[0].value + '(人)<br>公元649年,李治继位'; }else if (params[0].dataIndex === 6) { // Check for the year 690 return params[0].name + '年: ' + params[0].value + '(人)<br>公元690年,武则天继位'; }else if (params[0].dataIndex === 8) { return params[0].name + '年: ' + params[0].value + '(人)<br>公元712年,李隆基继位'; }else if (params[0].dataIndex === 12) { return params[0].name + '年: ' + params[0].value + '(人)<br>公元755年,安史之乱开始'; }else if (params[0].dataIndex === 13) { return params[0].name + '年: ' + params[0].value + '(人)<br>公元763年,安史之乱结束'; }else if (params[0].dataIndex === 20) { return params[0].name + '年: ' + params[0].value + '(人)<br>公元835年,甘露之变'; }else { return params[0].name + '年: ' + params[0].value + '(人)'; } } } - X轴Y轴
name:轴的名称。data:数据(x轴的数据为一个包含年份的数组)axisLine:轴线样式lineStyle:color——颜色,width——宽度
type:类型(指定y轴类型为数值型)max:y轴最大值show:是否显示intercal:刻度间隔
xAxis: { name:'年份', data: ["630","640","650","660","670","680","690","700","710","720","730","740","750","760","770","780","790","800","810","820","830","840","850","860","870","880","890","900"], axisLine: { lineStyle: { color: '#151d29', width: 2 } } }, yAxis: { type: 'value', max: 2000, name: '数量统计', show:true, interval: 400, axisLine: { lineStyle: { color: '#151d29', width: 2 } } } - 数据系列的配置:其中包含了柱状图和折线图两个数据系列的设置
- 我们需要条形图和折线图两个数据系列,于是每个系列用
{}包含,间隔用,隔开,整体用[]。 type:类型指定,条形图是bar、折线图是line。barWidth:指定柱状图的宽度showBackground:是否显示背景itemStyle:样式设置(如color)echarts.graphic.LinearGradient:创建线性渐变(0, 0, 0, 1)是线性渐变的方向,表示从 (0, 0) 点到 (0, 1) 点进行渐变,即从上到下的渐变方向。[{ offset: 0, color: '#ba5b49' }, { offset: 0.7, color: '#d2a36c' }, { offset: 1, color: '#dfd6b8' }]是渐变的颜色配置,它表示从起始点到偏移值为 0 处使用颜色 ‘#ba5b49’,到偏移值为 0.7 处使用颜色 ‘#d2a36c’,最终到达终点时使用颜色 ‘#dfd6b8’。
emphasis:高亮样式设置(即鼠标悬浮后的颜色变化)data:数据项的具体数值yAxisIndex:指定对应的y轴(有时候可以是双y轴)smooth:针对折线图,是指平滑曲线
series: [{ type: 'bar', barWidth : '70%', showBackground: true, itemStyle: { color: new echarts.graphic.LinearGradient(0, 0, 0, 1, [ { offset: 0, color: '#d2a36c' }, { offset: 0.5, color: '#d5c8a0' }, { offset: 1, color: '#dfd6b8' } ]) }, emphasis: { itemStyle: { color: new echarts.graphic.LinearGradient(0, 0, 0, 1, [ { offset: 0, color: '#ba5b49' }, { offset: 0.7, color: '#d2a36c' }, { offset: 1, color: '#dfd6b8' } ]) } }, data: [1357, 969, 1063, 1355, 1444, 1350, 1438, 1412, 1760, 1508, 1451, 1817, 1532, 1431, 1811, 1780, 1830, 1530, 1509, 1401, 1204, 1053, 380, 76, 36, 19, 12, 6], yAxisIndex: 0 },{ type: 'line', smooth:true, data: [1357, 969, 1063, 1355, 1444, 1350, 1438, 1412, 1760, 1508, 1451, 1817, 1532, 1431, 1811, 1780, 1830, 1530, 1509, 1401, 1204, 1053, 380, 76, 36, 19, 12, 6], yAxisIndex: 0 }] - 我们需要条形图和折线图两个数据系列,于是每个系列用
- 底部滑动条(数据缩放功能):dataZoom允许用户在图表中选择特定区域进行放大或缩小操作。
- 第一个对象表示外部数据缩放组件,
show: true表示显示该数据缩放组件。start: 0表示数据缩放的起始位置为 0,即最左边。end: 100表示数据缩放的结束位置为 100,即最右边。 - 第二个对象表示内部数据缩放组件,
type: 'inside'表示内部数据缩放组件,允许在图表内部进行缩放操作。start: 0表示数据缩放的起始位置为 0,即最左边。end: 100表示数据缩放的结束位置为 100,即最右边。
dataZoom: [ { show: true, start: 0, end: 100 }, { type: 'inside', start: 0, end: 100 } ] - 第一个对象表示外部数据缩放组件,
文章来源:https://blog.csdn.net/m0_63398413/article/details/135711384
本文来自互联网用户投稿,该文观点仅代表作者本人,不代表本站立场。本站仅提供信息存储空间服务,不拥有所有权,不承担相关法律责任。 如若内容造成侵权/违法违规/事实不符,请联系我的编程经验分享网邮箱:chenni525@qq.com进行投诉反馈,一经查实,立即删除!
本文来自互联网用户投稿,该文观点仅代表作者本人,不代表本站立场。本站仅提供信息存储空间服务,不拥有所有权,不承担相关法律责任。 如若内容造成侵权/违法违规/事实不符,请联系我的编程经验分享网邮箱:chenni525@qq.com进行投诉反馈,一经查实,立即删除!
最新文章
- Python教程
- 深入理解 MySQL 中的 HAVING 关键字和聚合函数
- Qt之QChar编码(1)
- MyBatis入门基础篇
- 用Python脚本实现FFmpeg批量转换
- 深入了解ReadDirectoryChangesW并应用其监控文件目录
- 阿里云Centos8安装Dockers详细过程
- Python多线程
- (自适应手机端)pbootcms企业通用网站模板 HTML5响应式网站源码下载
- cheat engine的使用
- JVM实战(29)——模拟栈内存溢出
- Spring的纯注解配置
- 【深度视觉】第五章:卷积网络的重要概念及花式卷积
- openssl3.2 - 官方demo学习 - cms - cms_comp.c
- 详解FreeRTOS:任务通知(高级篇—6)