3D多点触摸 TPE-920 3D Matrix Neo
Background
FSR (Force Sensing Resistor) sensors change their resistance propo?? onally to the force, or pressure, applied to them. It is possible to arrange the FSR sensors in a grid, or array, made up of rows and columns and this arrangement can be used to calculate pos?? on in the X or Y direction as well as force in the Z direction, hence the term 3D matrix sensor.
With specialized hardware it is possible to scan the rows and columns of an FSR matrix sensor and identify the force applied at each of the crossing points in the array. The hardware can then transmit this information to a PC or laptop where the raw data can be plotted and used as a pressure map or analyzed to determine the centroid and force of individual touch locationns.
Hardware Overview
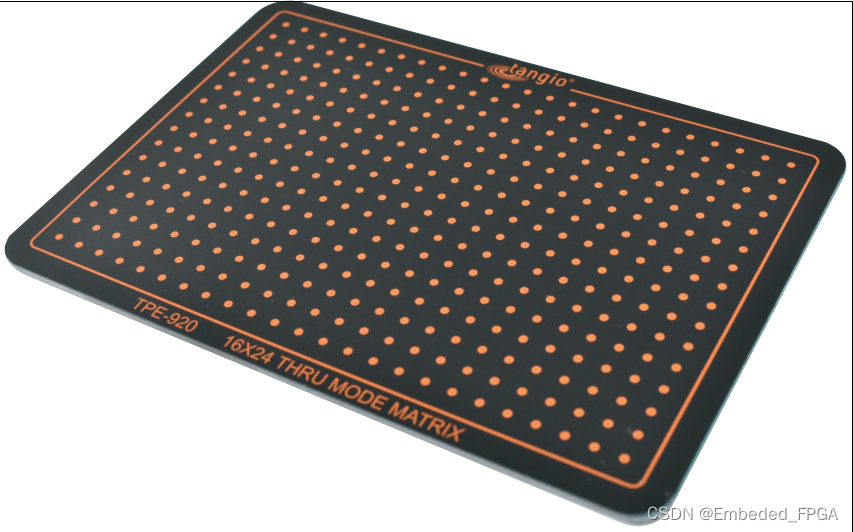
Tangio have developed a custom hardware and sensor demonstrator solution that allows for high speed scanning of a 16x24 matrix sensor. The output of the hardware/sensor can then be visualized using Tangio’s surface.exe software.
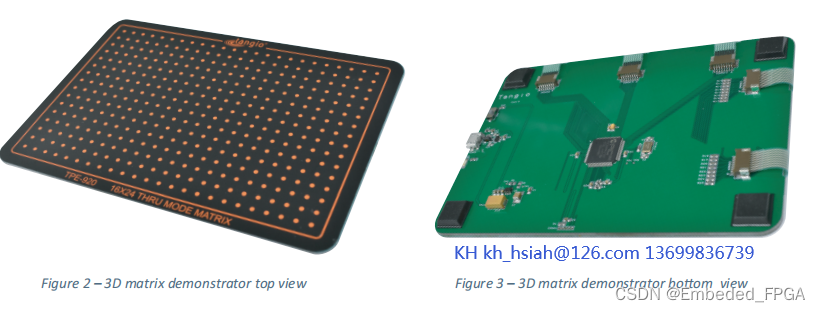
The 3D matrix demonstrator unit uses a Mirochip PIC32 microcontroller that processes data from aTangio TPE- 920 matrix sensor applied directly to the top surface of the PCB. The board is powered by a Micro-USB connector that also transmits the 10-bit serial data to a PC or Laptop.
Custom soō ware available from Tangio can record and/or display this data as a 3D or 2D surface graph.
Sensor Design
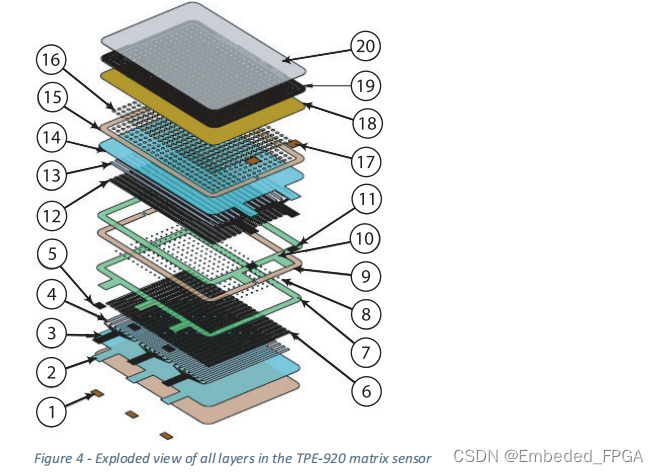
The TPE-920 matrix sensor on the demonstrator unit is available from Tangio as an oī -the-shelf sensor. The sensor consists of a graphics layer, top sensing layer (i.e. sensing rows), spacer layer, bottom sensing layer (i.e. sensing columns) and moun? ng adhesive layer. Each of these layers is constructed using various sub- layers.
The TPE-920 matrix sensor has been op? mized for use with the 3D matrix demonstrator.
Note however that each users intended applica? on has its own unique set of constraints and requirements and therefore in most cases a custom sensor solu? on is required. Tangio have optimized sensor design, construction, materials and layout for many varied unique 3D force sensing applications, from novel musical instruments to innovative medical sensors.
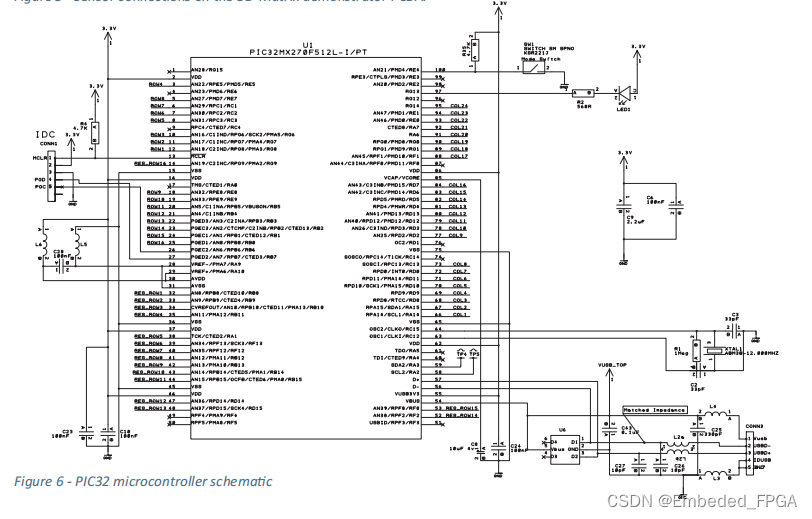
The TPE-920 matrix sensor connects to the 3D matrix demonstrator PCBA via 5 x 8 postion LIF connectors (2 x row connectors and 3 x column connectors). The pins for the connectors are assigned as follows:
? ROW1 to ROW16 are connected to ADC pins.
? COL1 and COL24 are connected to GPIO pins and can be configured as High or Low Impedance drive ports with max 15 mA source current.
? RES_ROW1 to RES_ROW16 are connected via 4.7K pull down resistors to GPIO pins that can be configured as Impedance (HiZ) ports or Low Impedance drive ports with min 20mA
sink current.
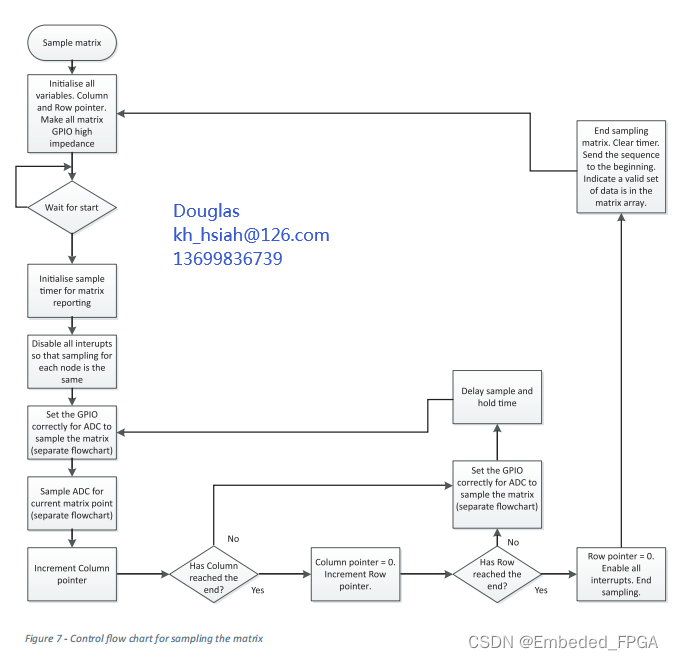
Hardware Control Flow Charts
The following control flow charts describe the three basic functions that are required to sample the matrix sensor:

Specification:
FSR matrix - 16 rows x 24 columns
Sensor spacing - 5mm pitch
Active area - 120mm x 80mm
Activation force - 50g
Scan speed - >15kHz per cell (40hz full sensor for 16x24 matrix)
Resistance range - 100kohms - 100ohms
AD force resolution - 10 bit (1024)
User Instructions
The 3D matrix demonstrator transmits serial data via USB. In order to record and display this data users must first install the custom software package “Surface” on their computer.
- Download the surface.zip and instal l surface.exe (PC) or surface.dmg (Mac).
- Connect the Matrix NEO 16x24 hardware/sensor via USB (serial port) to your computer.
- Run the Surface program, select the correct Serial Port from the drop down and then click “Start”.
- Once connected press the Matrix NEO sensor to see a 3D graphical representation on of the force data.
- To change the view of the graph, hold right click and drag. You are also able to change the se? ngs on the right of the graph to your preferred style or model (click on the colour pallets to introduce colour gradients as shown above).
- Range and sensi?? ity can be adjusted using the sliders on the right of the graph.
- To select certain points, go into the selection window and click item and select any point on the graph to see its data.
- After selecting a point, to see the column or row slice (2D - view), click Row Slice or Column Slice.
本文来自互联网用户投稿,该文观点仅代表作者本人,不代表本站立场。本站仅提供信息存储空间服务,不拥有所有权,不承担相关法律责任。 如若内容造成侵权/违法违规/事实不符,请联系我的编程经验分享网邮箱:chenni525@qq.com进行投诉反馈,一经查实,立即删除!
- Python教程
- 深入理解 MySQL 中的 HAVING 关键字和聚合函数
- Qt之QChar编码(1)
- MyBatis入门基础篇
- 用Python脚本实现FFmpeg批量转换
- (每日持续更新)jdk api之FileWriter基础、应用、实战
- camera 客观校准 (2)——抓图
- redis常见数据类型
- 腾讯云主机活动内容:领取总面值2000元代金券礼包
- FPGA-Verilog 仿真可视化
- 什么是TestNG以及如何创建testng.xml文件?
- 【数据结构入门精讲 | 第九篇】考研408排序算法专项练习(一)
- IO DAY2
- 怎么用开关电源ate综合测试系统进行反复开关机测试?
- 03 团队研究进一步详细介绍